
“For our non-technical users, Pyramid Analytics provides upfront simplicity with the ability to drill down into deep details if you choose. That’s fantastic because our executives need to trust that those details are there, whether or not they always need them.”
Speed Up the Journey from Data-to-Decision
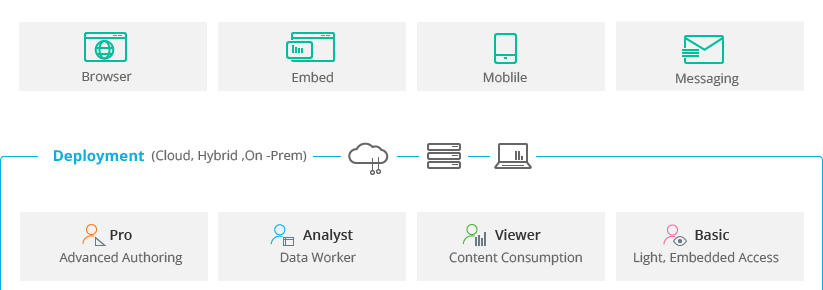
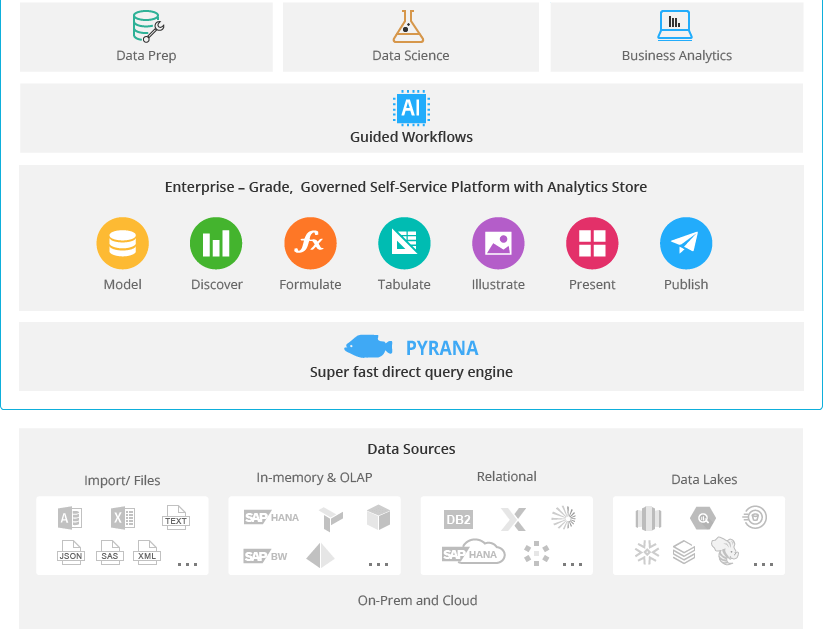
Pyramid’s Business Analytics Platform is a frictionless, integrated, no-code, AI-driven platform that combines data prep, data science, and business analytics capabilities. Everyone can self-serve by directly accessing multiple data sources across their environment with a tailored experience. The analytics stack is simplified and less complex, with a lower total cost of ownership.
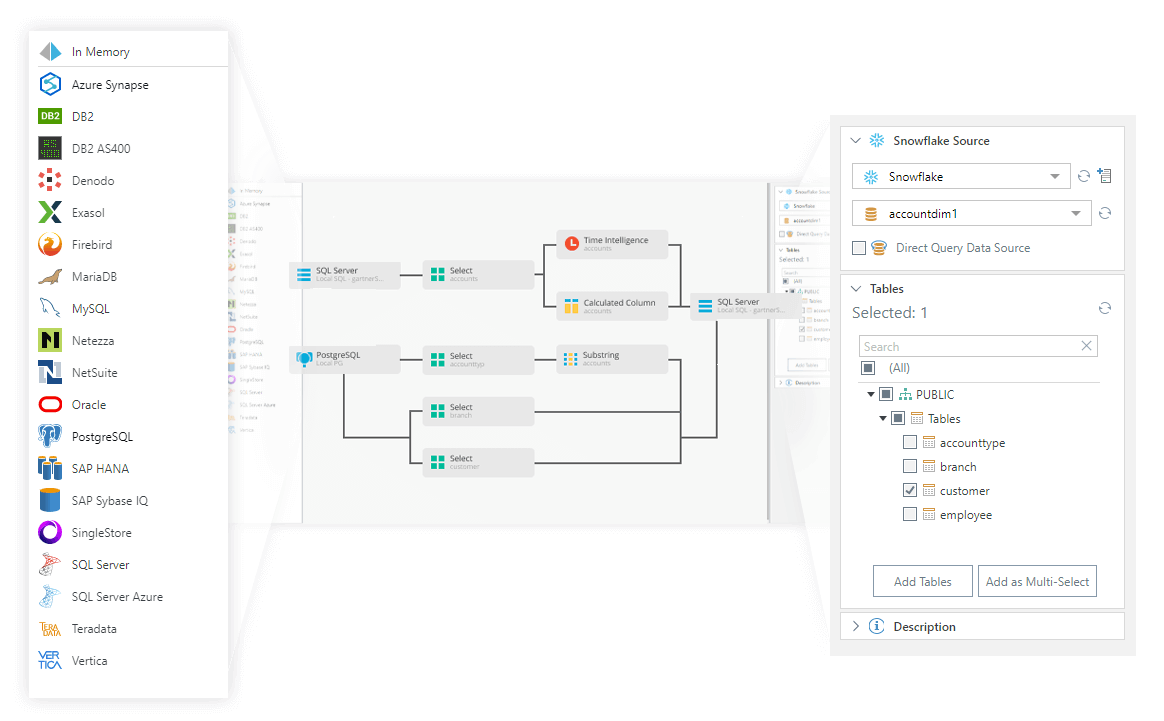
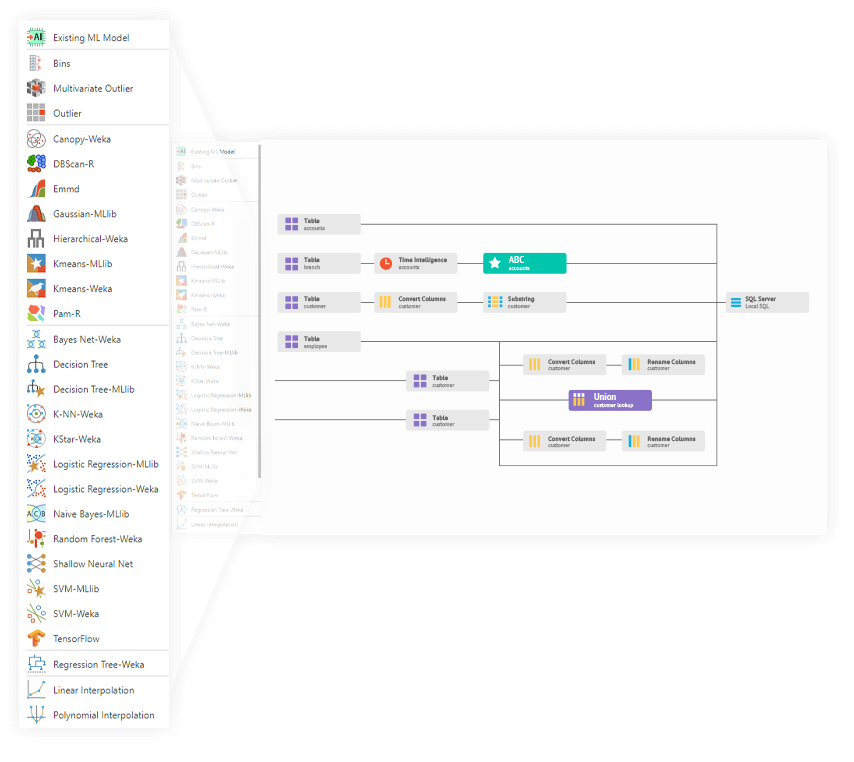
Meaningful Analysis with Integrated Data Prep
Build Interactive Analysis in Minutes
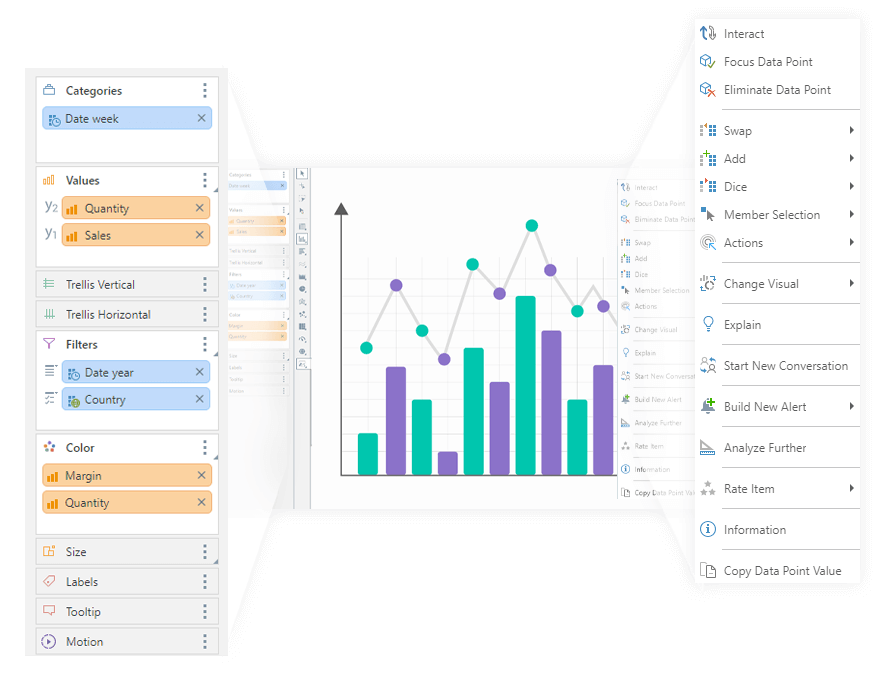
Faster Decisions with AI and Machine Learning
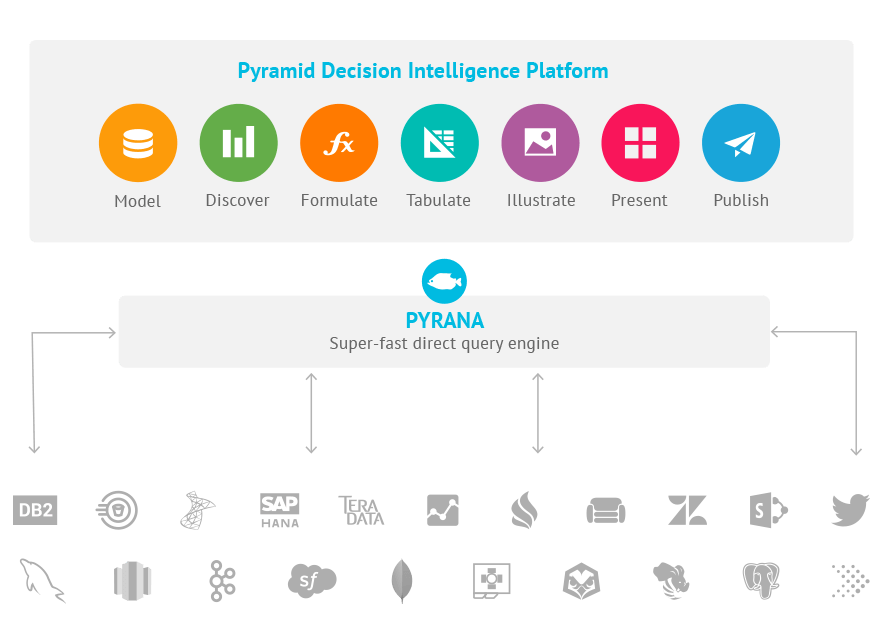
Get Super-fast Performance with PYRANA
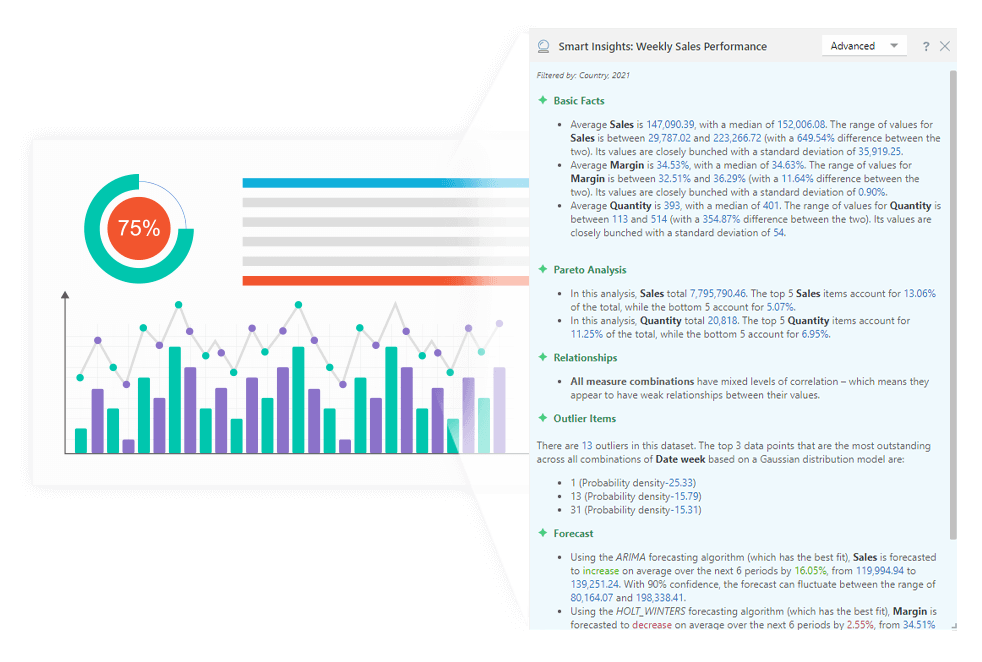
Elevate Self-service with AI-guided Workflows
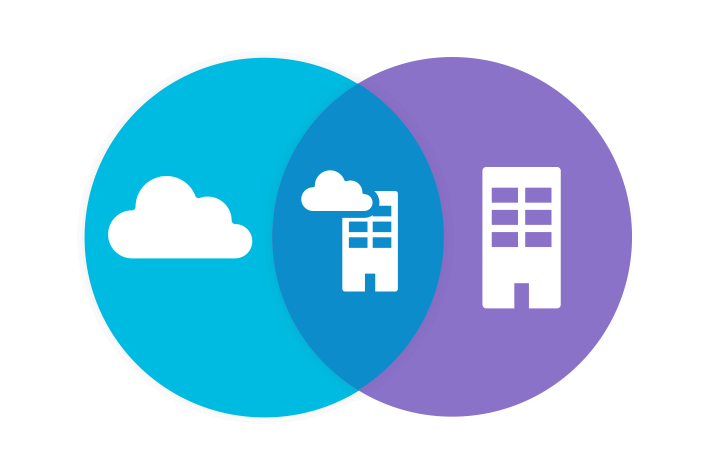
Deploy in Cloud, On-premises, or Hybrid Environments
Intelligent decisions start here.
Get A DemoTrusted by Leading Decision-Makers

“Data integrity and consistency is significantly better with Pyramid, and the speed of delivery of insights is much faster.”
Global BI Manager,

“Visibility is the number one benefit. Pyramid’s Decision Intelligence platform lets salespeople see up-to-date information in half an hour to an hour every day.”
Luke Dyer
Business Intelligence Developer, Videndum Production Solutions
“With Pyramid, the time it takes to get updated day-of-data into reports has decreased by 50-75%, allowing our clients to get their reports, and act on that data, much, much faster.”
Tamryn Le Riche
Head of Pyramid Commercial South Africa, DataOrbis
Explore AI-Driven Decision Intelligence for Anyone

Learn More About Decision Intelligence
Say Hello to Decision Intelligence
Read this guide to learn what decision intelligence is, what it isn’t, and how it's revolutionizing data-driven insights.
Read more

Mythbusting: 12 Myths Holding Back Your Organization
Learn how today’s BI “myths” are preventing organizations from moving past the limitations of traditional BI.
Read more