2020.10 is the latest release from Pyramid Analytics. It extends the functionality introduced in our major 2020 release. This is one in a series of posts that highlights some of the major new features.
The ragged query feature in Pyramid helps users create highly complex views of data that are extremely difficult to achieve with a standard BI tool. It allows users to easily “laser” out content items they do not want to see in a report—effectively building an “asymmetric” query.
The problem
Certain data elements are only useful for analysis in a specific context. For example, an analyst might want to view sales over multiple years, while simultaneously reviewing expenses for the current year only. The analyst is normally given two options: view sales and expenses separately, or else display the “unwanted” expenses together with sales amounts. Many tools allow the removal of either all elements, some elements, or no elements from a data grid. But picking out specific unique variations is a huge challenge. This is typically impossible or very difficult in most BI tools. So, the usual way to achieve this is by cutting and pasting the content into Excel. Of course, the whole idea of using a BI tool is to steer away from Excel as it runs against the entire concept of data governance.
Solution
Pyramid’s ragged or asymmetric queries (aka, “eliminations”) allow users to laser out specific elements to produce any type of query structure they want. All combinations of members and elements, representing hierarchies and measures, can be eliminated. This feature works uniformly on any type of supported data source too (another piece of magic), including SAP BW and HANA, Microsoft Multidimensional and Tabular, and all supported SQL engines. Eliminations can be triggered through a simple point-and-click functionality and via a more advanced wizard that gives you more control.
Business Case
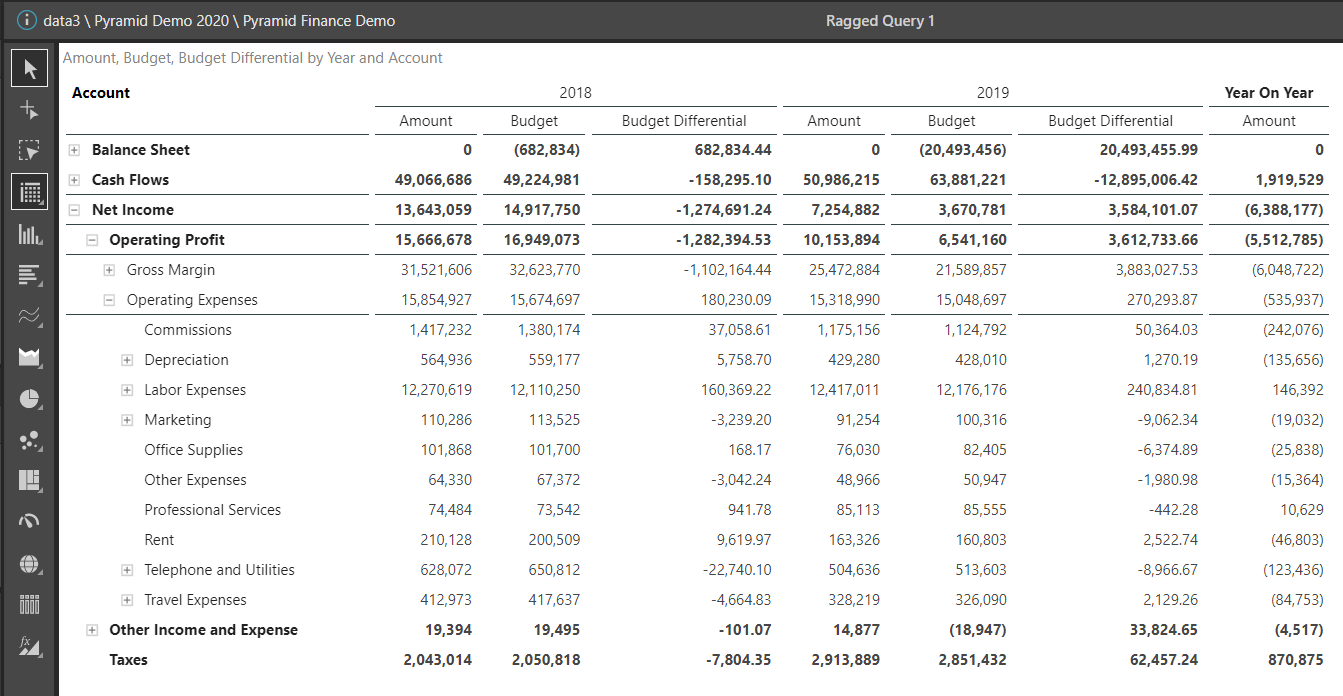
Janet, a business analyst at XYZ Retail Inc., is using Pyramid to query her SQL data warehouse. Janet needs to analyze actual operating expenses versus the budget for 2018 and 2019. First, she creates a formula showing the “Budget Differential” (the difference between Amount and Budget). Then, she creates a formula “Year on Year” that calculates the differences between 2019 and 2018 to review year-on-year differences, as shown below.
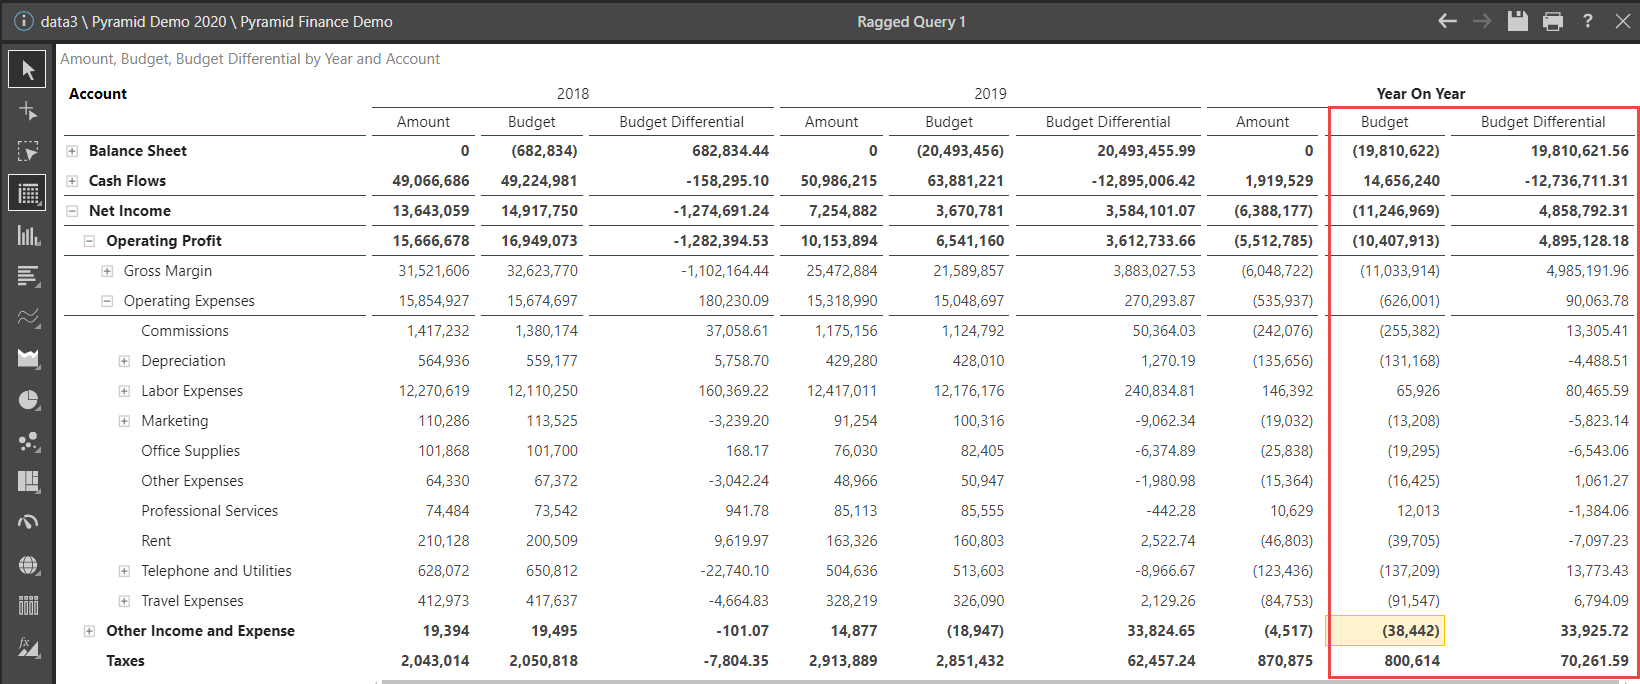
The glitch for Janet, however, is that she only wants to view the differences in actuals between 2018 and 2019, not the differences in budgets or the difference between the budget differentials. She really wants to eliminate the columns highlighted in the red box above.
Point-and-click option
With point-and-click simplicity, Janet eliminates the two columns that she does not want to view. She simply right-clicks on the columns she wants to eliminate and chooses which items to laser out of her report—as shown below.
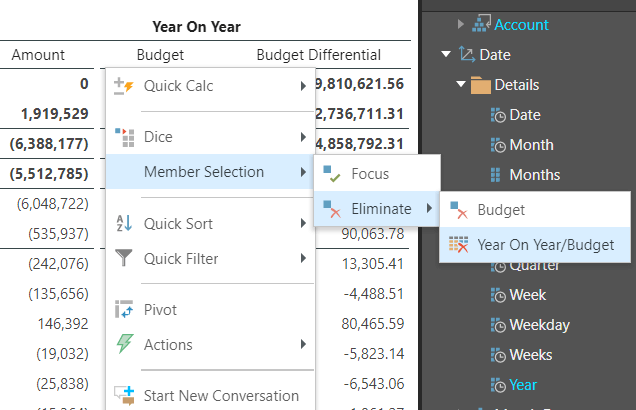
(Note how Pyramid provides the option to completely remove the budget for all hierarchies or to only eliminate the year-on-year budget.)
Janet performs the same elimination for the year-on-year budget differential and, voila, her report looks exactly as she wants it to, with her two columns removed. No Excel is required!
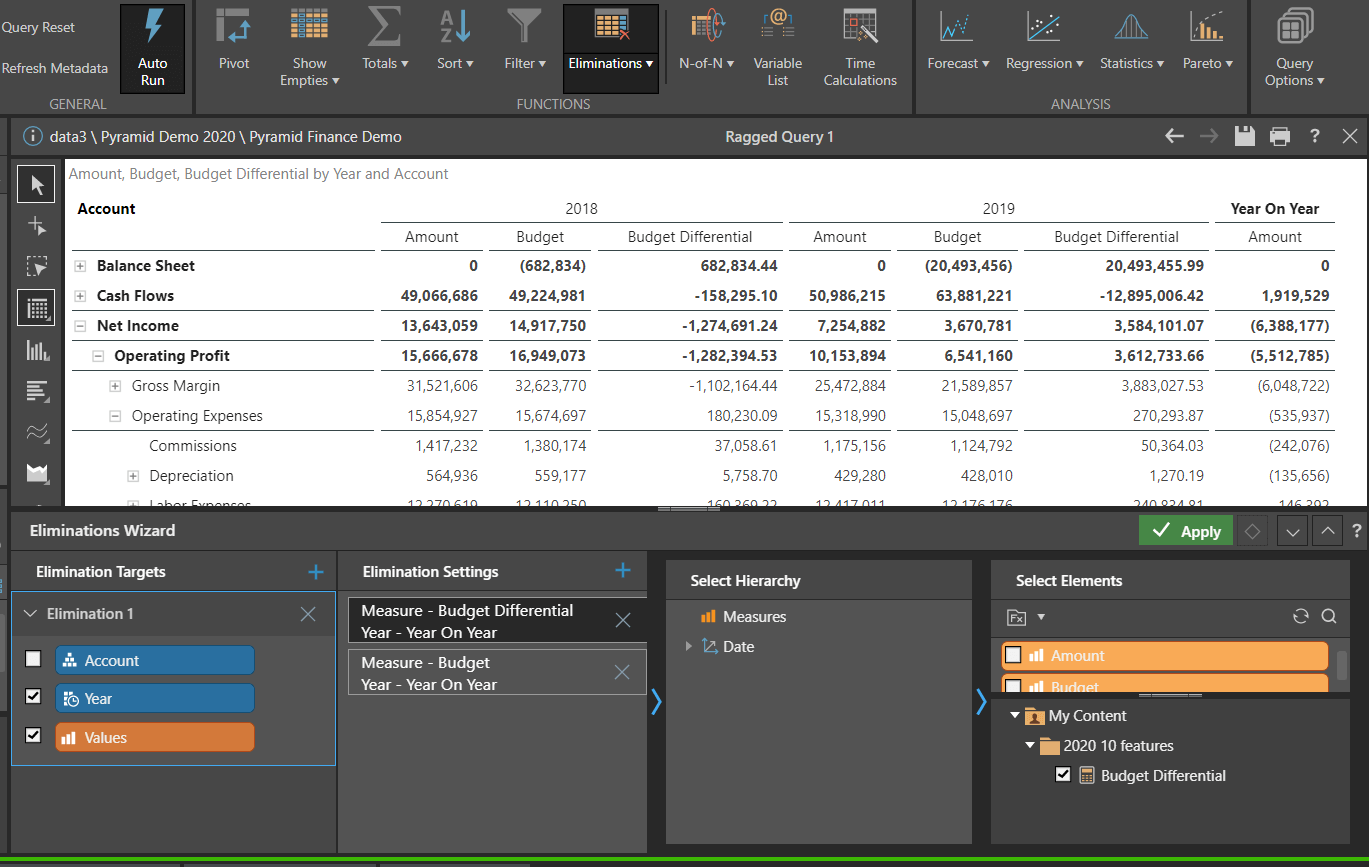
Eliminations Wizard
The Eliminations wizard is optionally available as a dropdown from the ribbon in a more controlled environment, where Janet can add, adjust, or remove elimination combinations.
Summary
Pyramid’s “Elimination” feature allows users to create highly customize reports with ragged or asymmetric queries by removing unwanted content that is normally difficult or impossible to remove with other BI tools. Using either point-and-click functionality or an easy-to-use wizard, users can effortlessly laser out elements and members from their reports to effortlessly design customized grids on any data source.
2020.10 new feature series:
Pyramid 2020.10 is chock full of powerful features like the ragged queries described above. For more detail about some of the other new headline features contained in the 2020.10, please see these additional write-ups:
- Post 1 – Calendar Slicer: The smart Calendar Slicer in Pyramid is designed to make date-time operations fast and simple for both novice and advanced users alike. It is especially useful when more date-time structures in the original data source do not exist and users do not want to use complex formulas to filter data with dates.
- Post 3 – Self-Building Data Catalogs: Pyramid provides users with a self-building and self-maintaining documentation mechanism for data and analytics. The ‘Data Catalog’ helps analysts and administrators to find the data or analytical assets that they need.
- Post 4 – Data Catalog Toolkit: Learn about Pyramid’s Structure Analyzer, Data Source Changer, and Lineage tool, all of which provide a graphical, intuitive set of mechanisms to all the elements in the system, fully exploiting the power of centralized data and asset cataloging.
- Post 5 – Flow Grids and Flow Charts: The flow grid and flow chart tools in Pyramid are designed to dramatically extend the grid and chart capability for publications.
- Post 6 – Present Lite: The new Present Lite tool is designed to create quick and easy dashboards for non-technical users. Users will experience a simplified UI with fewer advanced features, and they will get all the essential tools required for creating self-service, self-built dashboards.
- Post 7 – Audit Logs: Pyramid’s Audit Trail provides users with a framework to track all changes made to key objects throughout the system – providing administrators with a clear view and history of when an object was created, changed, or deleted, by date and by the user.
- Post 8 – Datavard Glue: Pyramid now integrates seamlessly with Datavard’s “Glue” – a third-party tool that allows users to trigger and extract raw SAP ERP data. The data can then be ingested into Pyramid by end users for further analysis and reporting.
- Post 9 – Content Migration: Pyramid users can easily migrate content from one Pyramid instance to another with an easy, intuitive wizard assisting them through the process. This facilitates the re-use of content items with efficient processes to ensure governance and security.


