How to share data with colleagues with your comments on specific data
Effective collaboration by multiple stakeholders is very difficult to achieve when all members utilize a desktop version for analysis and server versions for collaboration. Pyramid provides business users with a collaboration tool on a platform that all users are actively using exclusively for all their BI functions.
Why is collaboration so important?
Today, more than ever before, businesses have converged on the idea that our decisions need to be collaborative. An individual may not uncover insights by analyzing data alone. Knowledgeable stakeholders and colleagues can provide additional insight into why data may be trending up or down based on external factors that are not immediately apparent.
Does this scenario sound familiar?
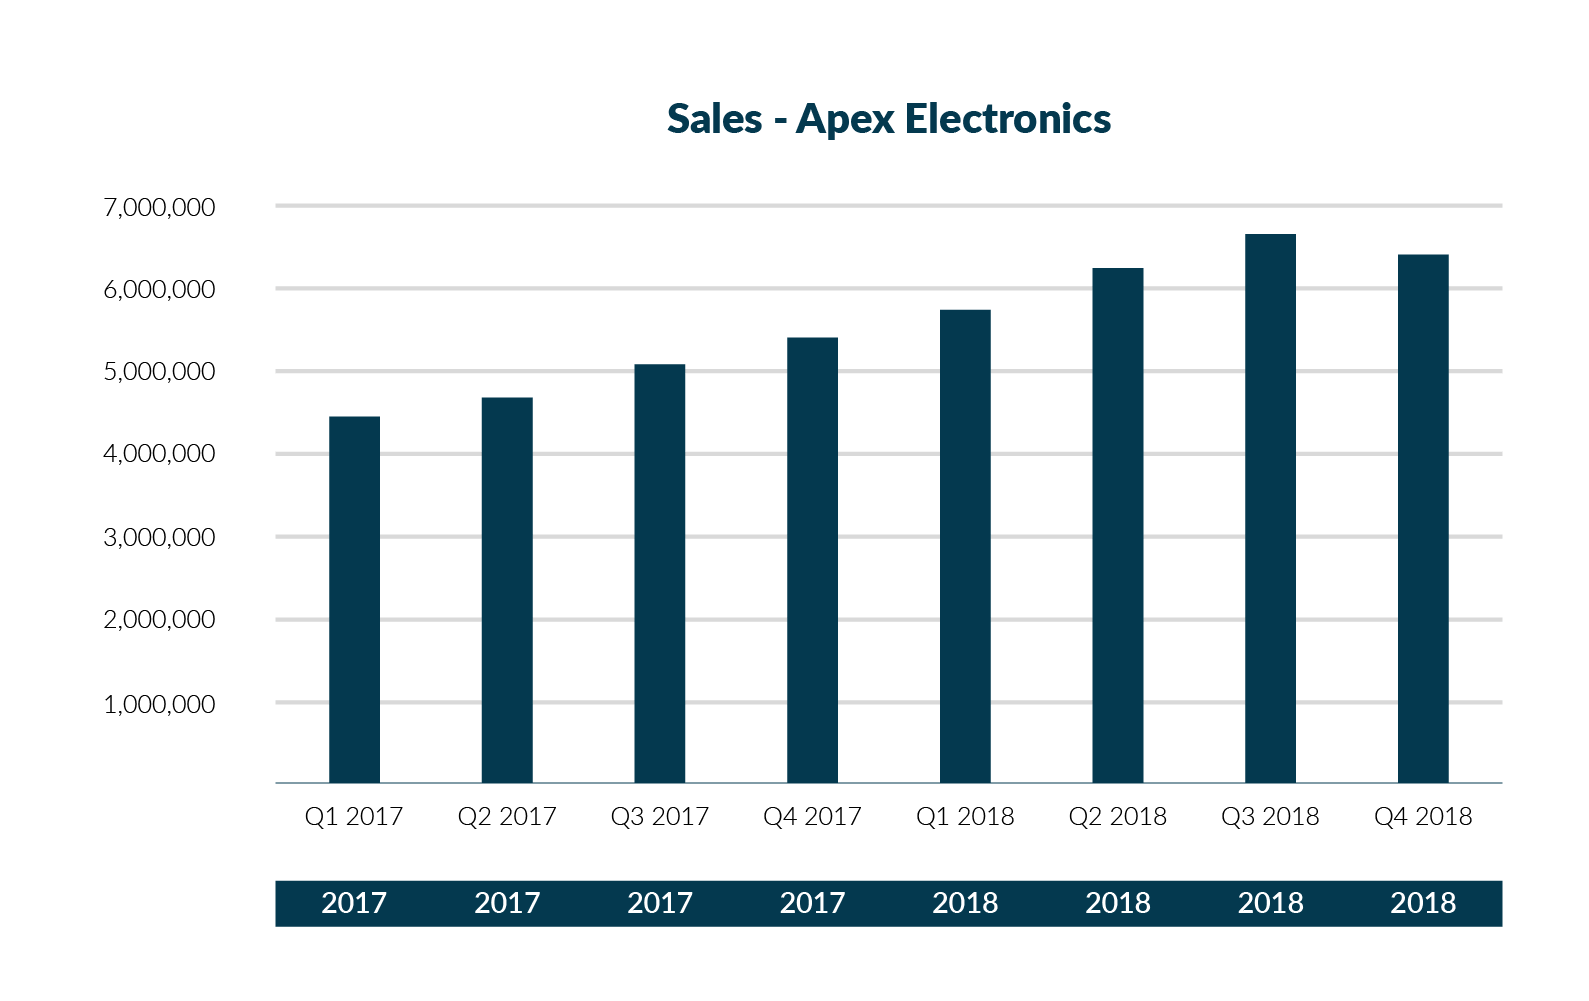
John, the CFO for Apex Electronics using his desktop BI tool, sees the sales figures for the current quarter is down by 3%, after a consistent 2-year upward trend of between 5% and 8%.
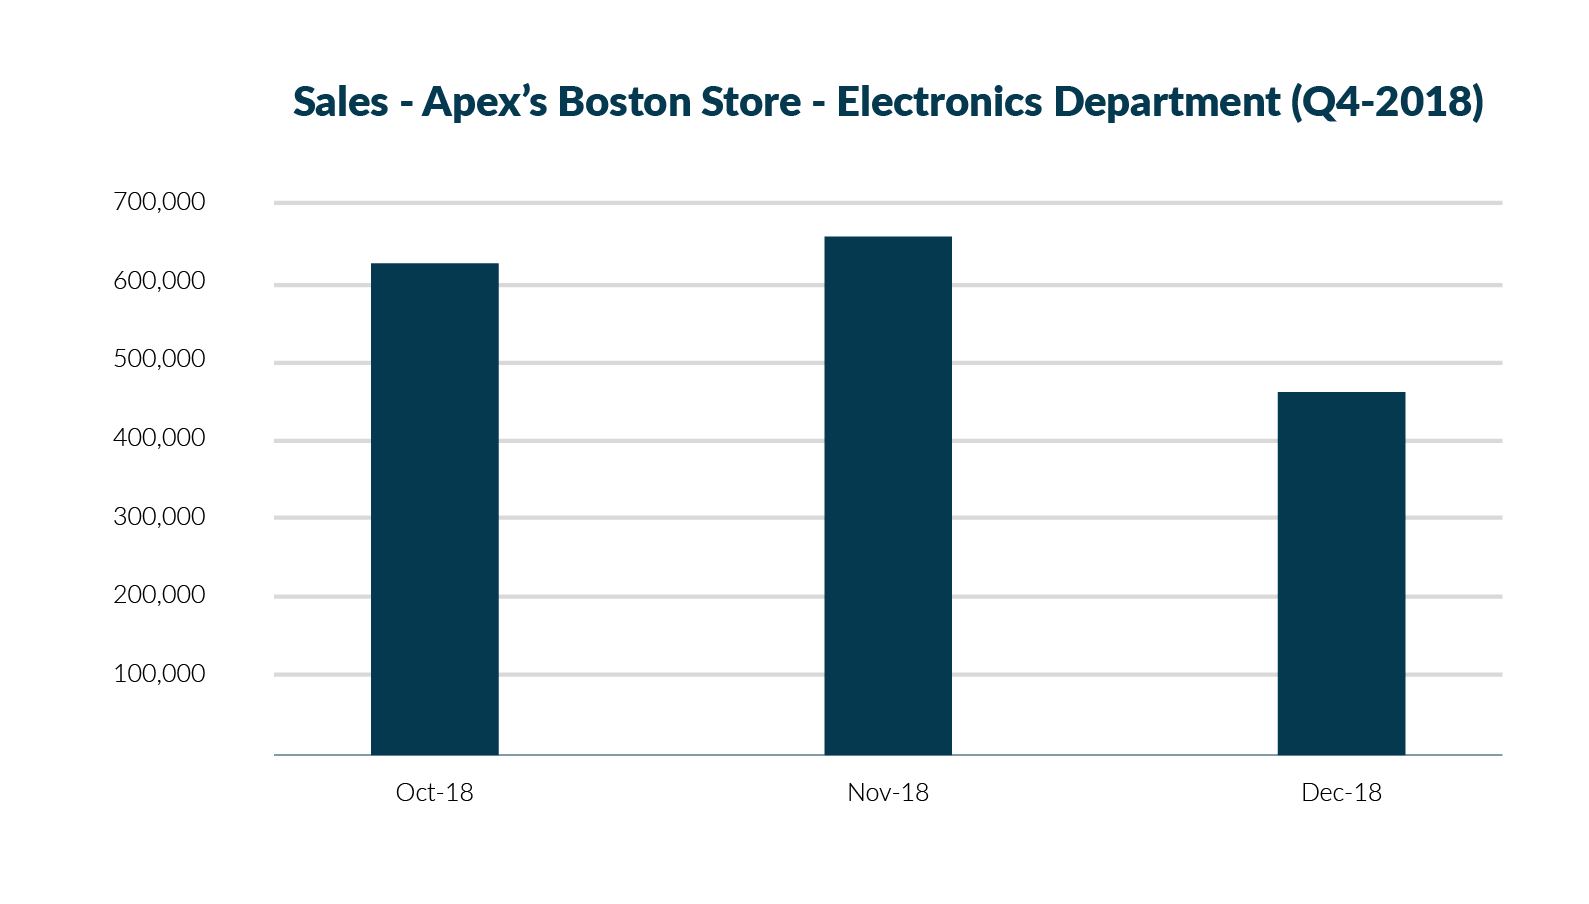
After further interrogation of his cube (drilling, slicing and dicing), he discovers that sales in the Boston store’s electronics department have decreased by 30% in December, dragging down company-wide quarterly sales.
Difficulties collaborating with traditional desktop BI tools
- Team members using a desktop version of their BI tool are unable to share their reports and visualizations after drilling, slicing and dicing their data. In order to share their results with others, they must upload/publish individual reports or analysis to the web-based solution (usually with inferior capabilities), and in the process force their fellow-collaborators to change platforms too.
- Users can’t view historical data at the time of initial collaboration and compare it against current data and report views.
- Users are unable to record voice messages and attach multimedia files.
Data security is bypassed when a snapshot of the report is sent via email to all fellow collaborators as all members don’t always have the same access rights and users could view unauthorized data.
Ease of collaborating with Pyramid
- All users use the same universal web-based client, so the initial collaborator can share their reports and discoveries in a central repository after drilling, slicing and dicing. No change in platforms required.
- Comments and annotations within analytic reports and dashboards provide direct access to both current and historical versions of both the report and component data.
- Users can record voice messages and attach multimedia files in a user-friendly interface.
- Data security is applied on a per-user basis, so users can only view data they are authorized to view.
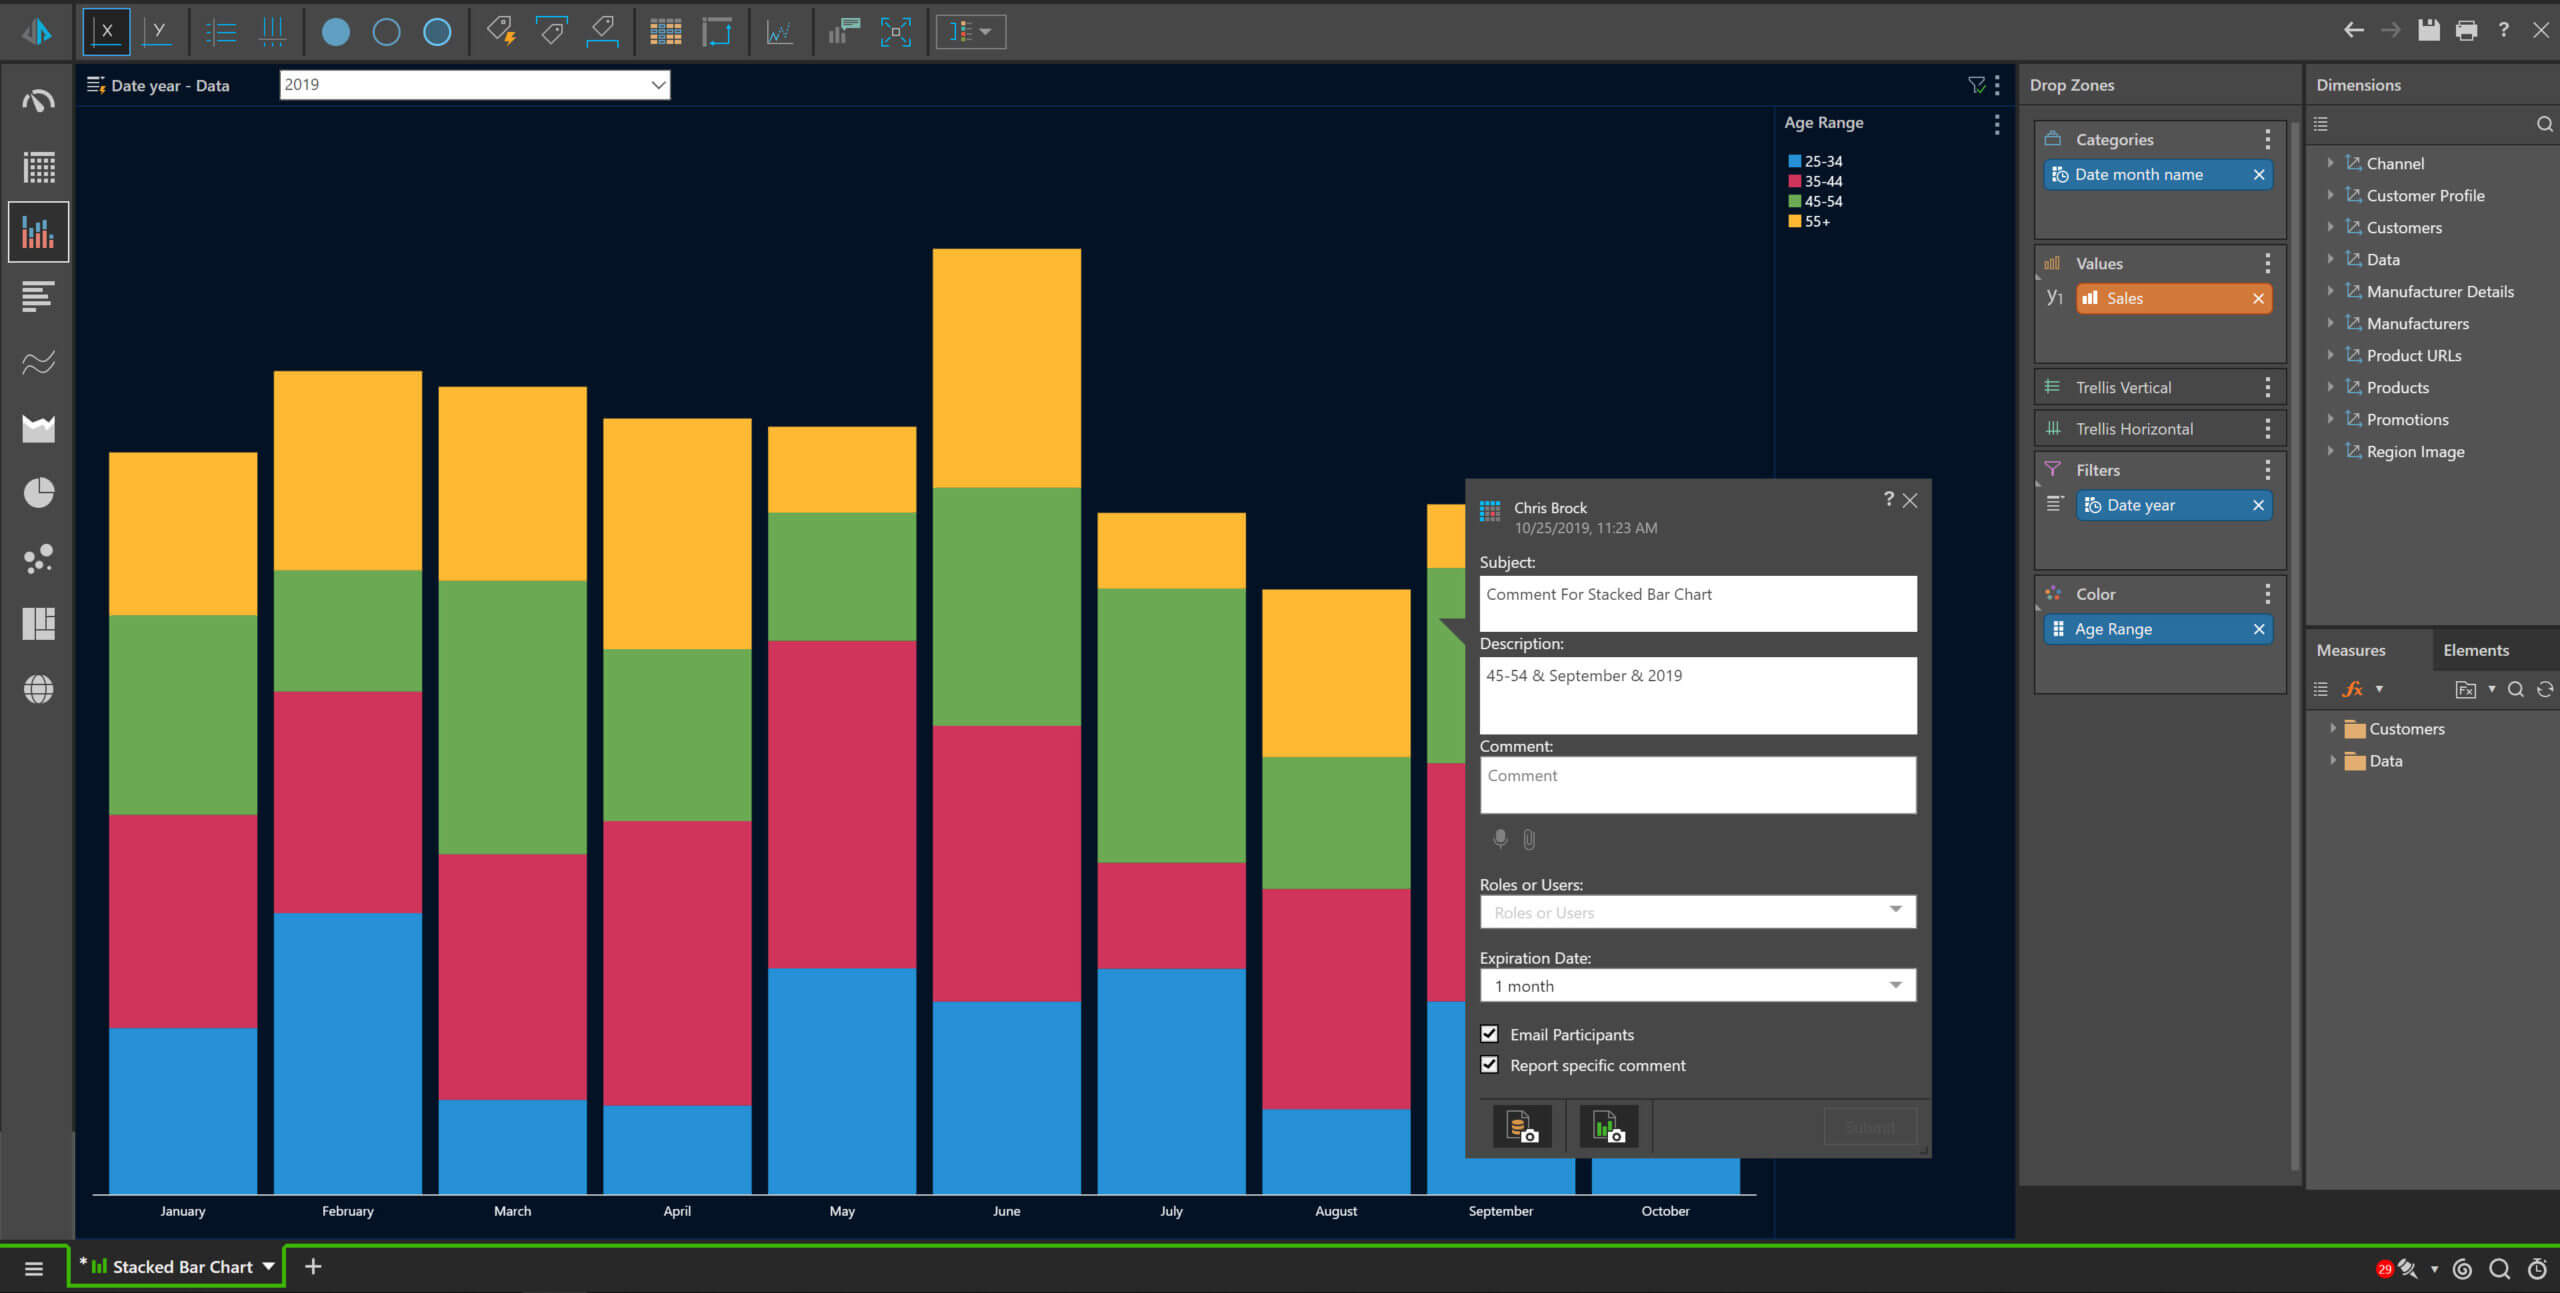
Threaded Conversations and Comments
In the Pyramid application, comments and conversations among colleagues can take place directly within analytic reports and dashboards. Conversations greatly expand the depth of analytics by creating social hubs around analyses. Sharable insights make it easier to discuss results and to create actionable lists for users on the platform. Data and report snapshots allow users to track changes over the lifecycle of a conversation thread.
Comparison between Pyramid vs Classic Collaboration
Below, we compare the approximate time it takes to produce a single data visualization using a desktop-based BI application versus Pyramid.

With Pyramid’s commenting functions, users have a powerful, ubiquitous, simple and user-friendly collaboration tool built right into their analytics platform.


