Bursting analytic reports to recipients is still a very common “real-world” requirement—and it’s still a “real-world” headache for many organizations who depend on published reports to communicate vital information to stakeholders.
Often referred to as ‘Enterprise Reporting’—the process of publishing the same template of content with specific “slices” of the underlying data—report bursting is not a new concept. In fact, it’s one of the original ways data was consumed by business users before live, interactive data access became a realistic option. Classic examples include:
- Sending every department manager their monthly P&L
- Emailing every investor a report with the status of their portfolio
Despite the march of progress in both business processes and technology, pushing content to individuals on a scheduled basis is still one of the main conduits for delivering data to drive business decisions. Strangely, this function is ignored by most BI tools, often forcing customers to use one technology for live, interactive analytics and a separate solution for enterprise reporting.
Pyramid offers both in its platform. Indeed, the functionalities are both symbiotic and cross-functional—making the process of producing live interactive analytics and the matching static, bursted content simple, cost-effective, and copacetic. Complete with smart scheduling, auto-distribution engines, and the ability to direct specific report content to specific users, enterprise reporting in Pyramid is powerful—while still presented as a slick, self-service toolset for the modern era of business analytics.
The problem
There are two primary enterprise reporting challenges that organizations face: first, how to create and distribute static content to users; and second, how to automate this process with sophistication but without complexity—avoiding the tedious and time-consuming effort required to create numerous reports manually (or the complex steps that require coding).
Report bursting
Live, interactive access to analytics and data is not always feasible. There is always a population of users who do not want (or cannot get) access to live, interactive systems and content. This may be due to security concerns, resource constraints, or simply a lack of training. Bursted, static reports can make a large dent in this problem set.
Report bursting, typically, produces personalized content based on a single report template, ensuring users only receive what they need, when they need it. However, most report-bursting solutions are usually distinct platforms, separate from their interactive counterparts. This means different content, data source setups (and modeling), and potentially a different look and feel, usually requiring different development skills and an altogether different technology setup.
AUTOMATION
When bursting a report with different data slices to multiple recipients, it is a tedious task to create the same report many times, each time changing the selection for a different branch, department, product category, or any other criteria. The alternative is to develop code to perform the distribution, but the architecture of BI tools and technical difficulty of this approach this normally precludes this option.
Further complexity arises when a report needs only to be distributed to a specific recipient under certain circumstances. Defining the conditions within the report itself proves to be either technically challenging or impossible. For example: when a manager wants only to publish the report for branches where total returns are more than five percent of sales.
Most modern BI tools do not offer the ability to perform report bursting—let alone accommodate the nuances of automating the core functions of distribution and content personalization. This usually requires one or more other technologies.
Pyramid’s solution
Pyramid provides both live, interactive analytics and static report distribution within the same solution. The powerful report-bursting capability enables users to receive customized content using specific (sometimes personalized) data. Only a single report template is required—no more manually building and running multiple visuals and content (items that require error-prone cutting and pasting).
Most importantly, the content, data modeling, security, and logic used for the interactive access are the same used to drive the static, burst content. These synergies produce tremendous efficiencies and consistency across the entire analytics ecosystem.
Further, the application provides total flexibility in deciding when and how to schedule the publication. Distribution can be performed using existing users, roles, or scripting. Advanced features include the ability to conditionally replicate pages for different slices of data (covered in the next blog). Other functions like “report triggers” and “page triggers” allow conditional deployment and distribution of reports, ensuring the publication and content are only delivered when relevant. Reports can be published in PDF, Word, Excel, PowerPoint, XML, HTML, PNG, or JSON formats.
This ultimately culminates in a “targeted reporting” framework where each user receives their own content in a report. What’s more, all of it is designed and executed by business users who understand the analytic and reporting requirements and can build and deliver it themselves without the help of intermediaries. This is the holy grail of enterprise reporting and analytics.
Business case
Shane is a BI analyst for E&G Manufacturers. E&G uses Pyramid to analyze their data currently housed in a Pyramid in-memory database. Shane wants to publish a detailed branch returns report. He must automate the distribution of the report to all branches, but only to branches where the value of the goods returned was more than 12% of sales. Those branches with less than 12% returns do not need to be alerted.
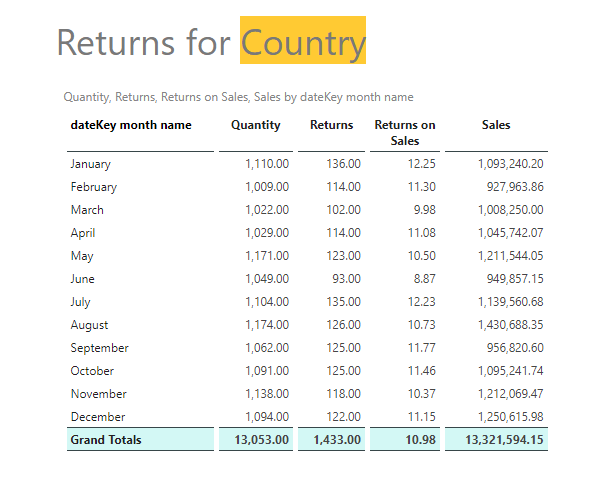
First, Shane defines the report using the Publish tool using a slicer to filter the report by country. He creates a country placeholder to display the filtered country.
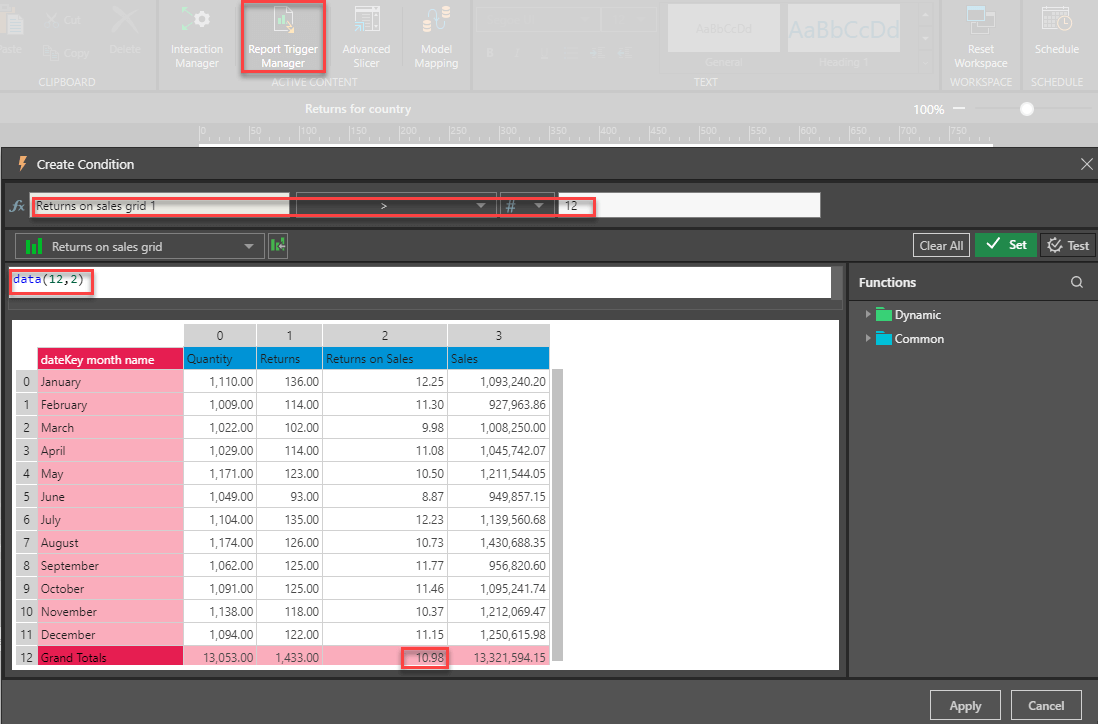
Next, Shane uses the report trigger manager to define the condition to be met before publishing the report. He selects the Return on Sales percentage per country and then sets the conditional trigger to only publish the result if the Return on Sales figure is greater than 12.
Shane then includes the country slicer to be used in conjunction with the trigger to ensure the report runs with data per country.

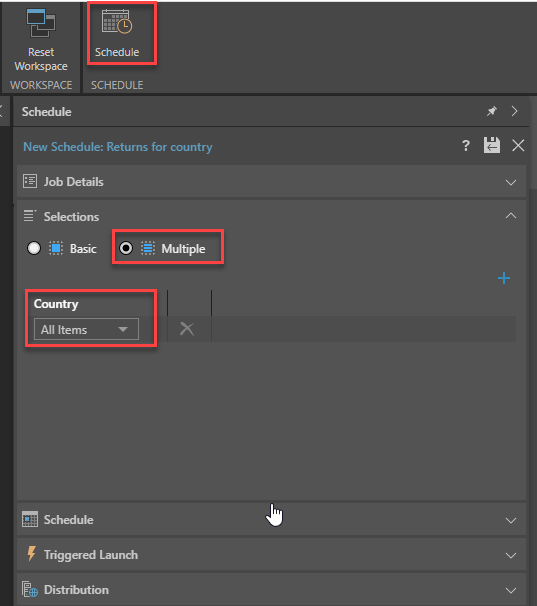
Shane now includes multiple selections for the schedule to ensure the condition is run against every country.
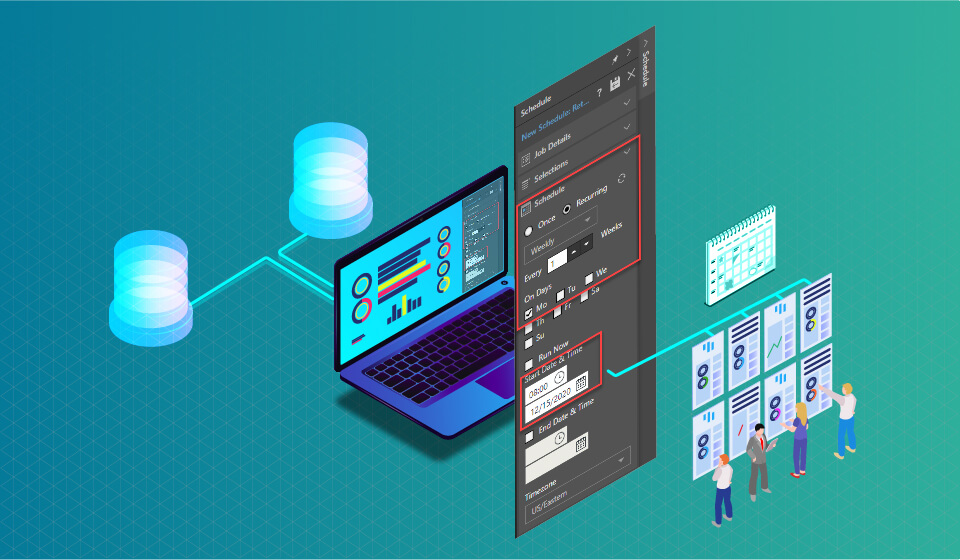
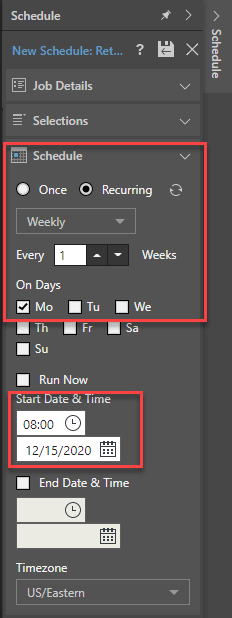
Shane then schedules the report to run every Monday at 8:00 a.m.
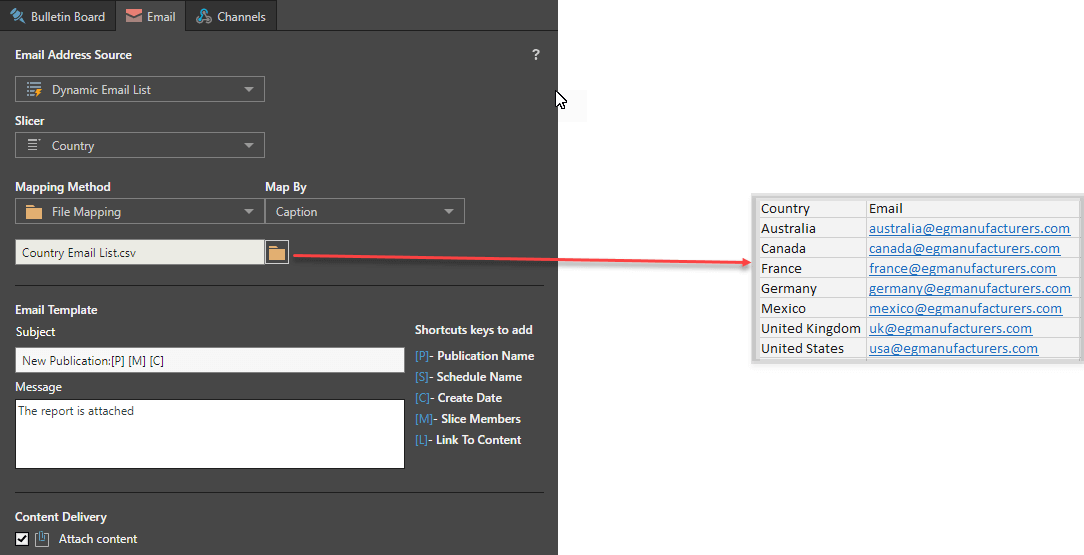
Finally, Shane uses a file distribution list as the distribution method, using the Country slicer to determine the recipients and the Country Email list to ascertain the email address to be used. The email text will be generated at runtime using the shortcut keys. (Note: A more powerful distribution option that uses the data in the database will be shown in the next blog.)
In a few quick and easy steps, Shane has created a report, used a trigger to define a condition for publishing, scheduled the report, and distributed it via email. And he’s done all this using a single platform for analytics and report distribution. That means all content can be used (and re-used) for both purposes.
Summary
Report bursting is a critical aspect of enterprise reporting, where reports containing personalized content are generated from a single report template. The report can then be distributed to recipients based on the report content. Most BI tools providing live interactive analytics do not offer report bursting. This forces companies to implement a completely different solution. And even amongst those that do incorporate report bursting capabilities, the use of dynamic data can be difficult or impossible.
Pyramid’s highly flexible Publish tool is used to create dynamic and flexible report templates that can deliver specific report content to specific users with different data, messages, and formats. Importantly, it’s just one of the modules in Pyramid and works symbiotically and synergistically with the rest of the interactive analytic components. In this way, Pyramid delivers live, interactive analytics and enterprise reporting in a single, cohesive platform.


