Python has rapidly become developers’ top choice for machine learning and deep learning projects. Machine learning allows users to feed massive amounts of data into a computer algorithm to get data-driven recommendations and decisions based only on input data. Pyramid enables Python code to be used either as a data source or for data manipulations on up to billions of records, allowing resultant data to be written back to a database. The integration of Python into Pyramid’s self-service BI, with its powerful drag-and-drop data extraction and preparation tools, provides non-technical analysts with the ability to work extensively with Python functions without having to write any code.
The problem
The Python language is an overwhelming favorite for machine learning and development in general. However, users wanting to perform analytics still require a self-service BI tool to create dashboards, presentations, and reports using the output from Python. Reuse of code remains a huge challenge for enterprise users who need to share code as well as access data sources, dashboards, reports, and publications. Python’s siloed environment excludes non-coders from testing and further analyzing models using self-service BI tools.
Third-party vendors like Power BI and Tableau have serious limitations in integrating Python. With those tools, Python code is not run as a batch processing job—instead, it is primarily run inline when generating discoveries, so it’s always limited to small data sets and small business problems, not real-world machine learning challenges. In these scenarios, the Python scripts are processed against aggregated values rather than on the granular data. The other major gap is that Python ML models trained on a data set cannot be easily created, saved, and shared—let alone reused—to predict values on the larger population data set.
In many respects, most BI tools treat Python as a side-show gimmick without any serious treatments or integrations.
Pyramid’s solution
In stark contrast, Pyramid has made Python (and R) a first-class citizen in its architecture and product strategy.
Pyramid integrates Python into its Model tool, allowing users to utilize Python code as a data source or as a data manipulation and calculation element. The Model tool allows Python to perform basic aggregation, calculations, and data manipulations on data using any degree of logic afforded by Python. Python machine learning models can also be trained, tested, and then deployed to run predictions on millions or billions of records and can be shared and re-used in other data sources.
Governance of the Python scripts is also maintained with managed access and content versioning. The process of extracting and preparing data for a learning script that is normally performed by a Python developer can be performed using drag-and-drop actions by other professionals without deep Python skills, saving huge development effort. The ability to write back results from the Python code to the original data source provides a powerful means of adding to the value chain built by Pyramid.
A marketplace with free reusable Python source code provides non-technical analysts with a large library of predefined functions. Further editing, code-creation, testing, and running of Python code can all be performed from within Pyramid. Pyramid’s entire self-service BI is then available for all analysts to create dashboards, reports, publications, and more from the resultant data model.
In this blog, I will illustrate the formidable combination of Python and Pyramid in the context of stock market trading, where an analyst wants to quickly and easily source stock market data and create visualizations using Pyramid’s powerful self-service BI tools. In future blogs, I will demonstrate how Python can be used for forecasting and in a learn-and-predict scenario.
Stock market example
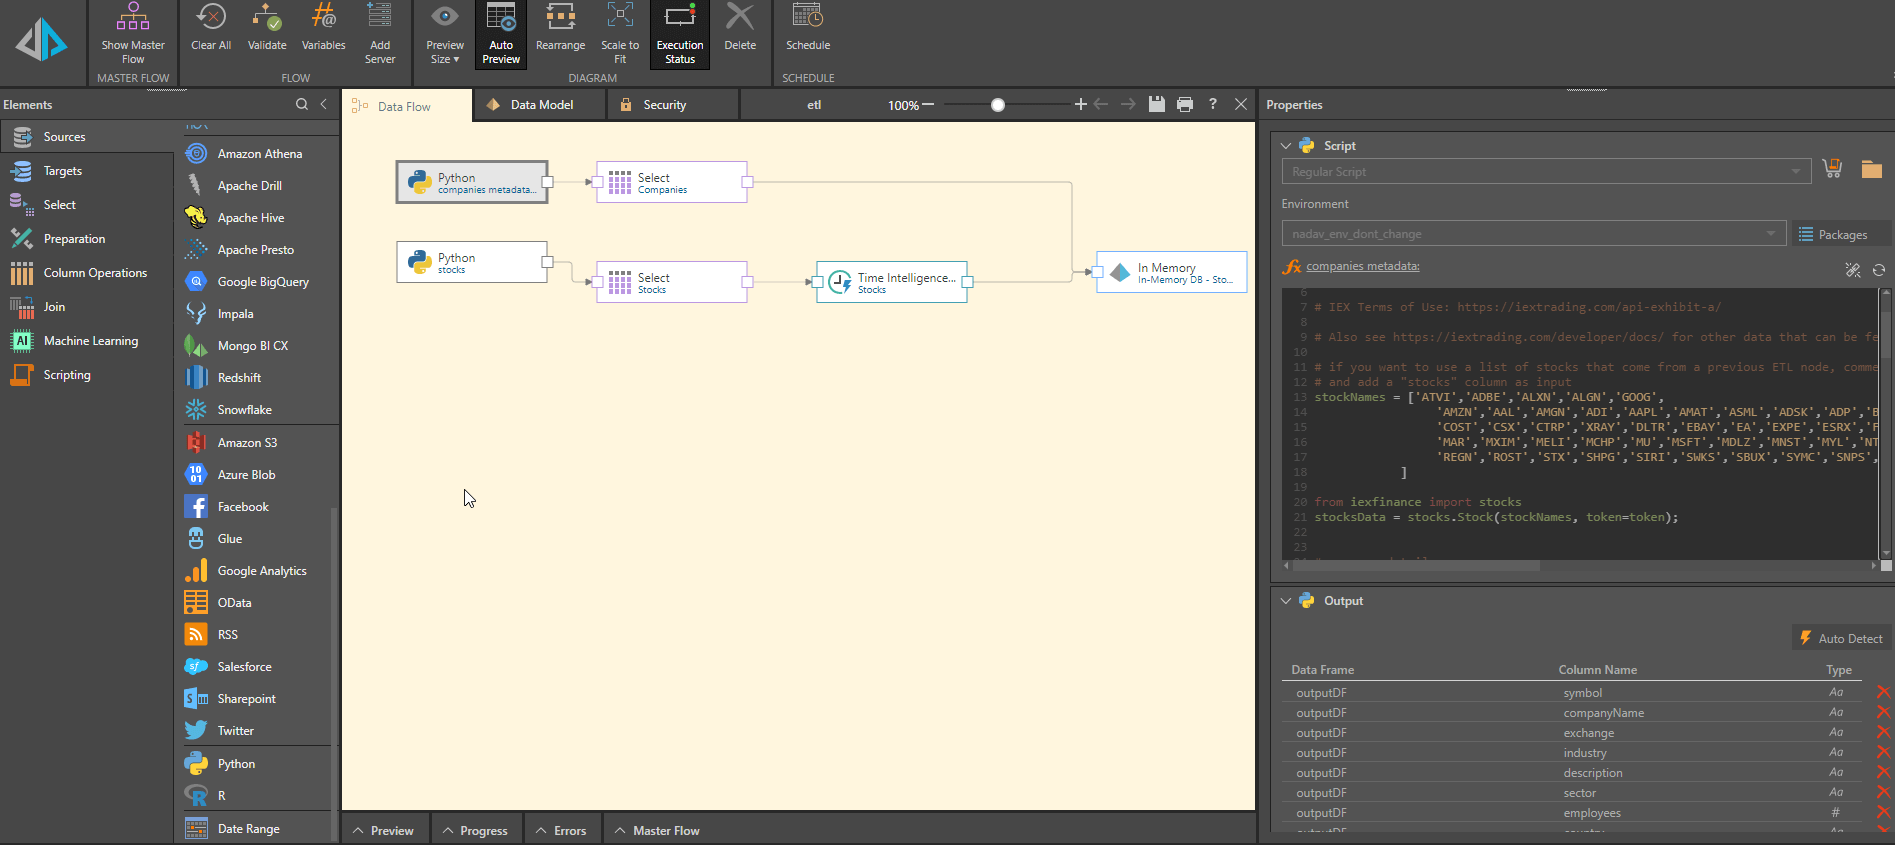
Using the Model tool in Pyramid with Python as a source, I first copy two separate Python scripts from the IEXFinance service for company data and stock price data. The script below fetches close, high, low, and open prices, and volumes.
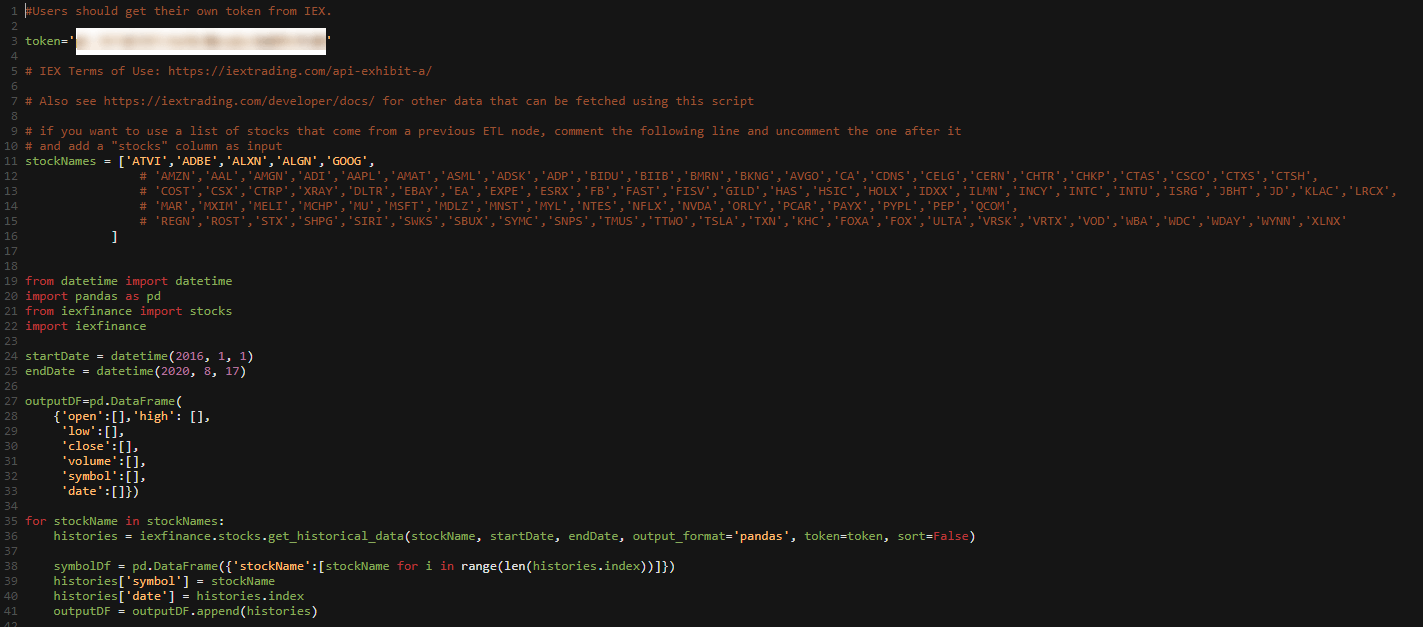
The second IEXFinance script retrieves the company name, exchange, industry, sector, et cetera. Both scripts are included in the Model tool that performs the ETL. Pyramid’s time intelligence is applied, and the data is stored in Pyramid’s in-memory database (but could be stored in any of the 27 target databases/repositories supported by Pyramid.)
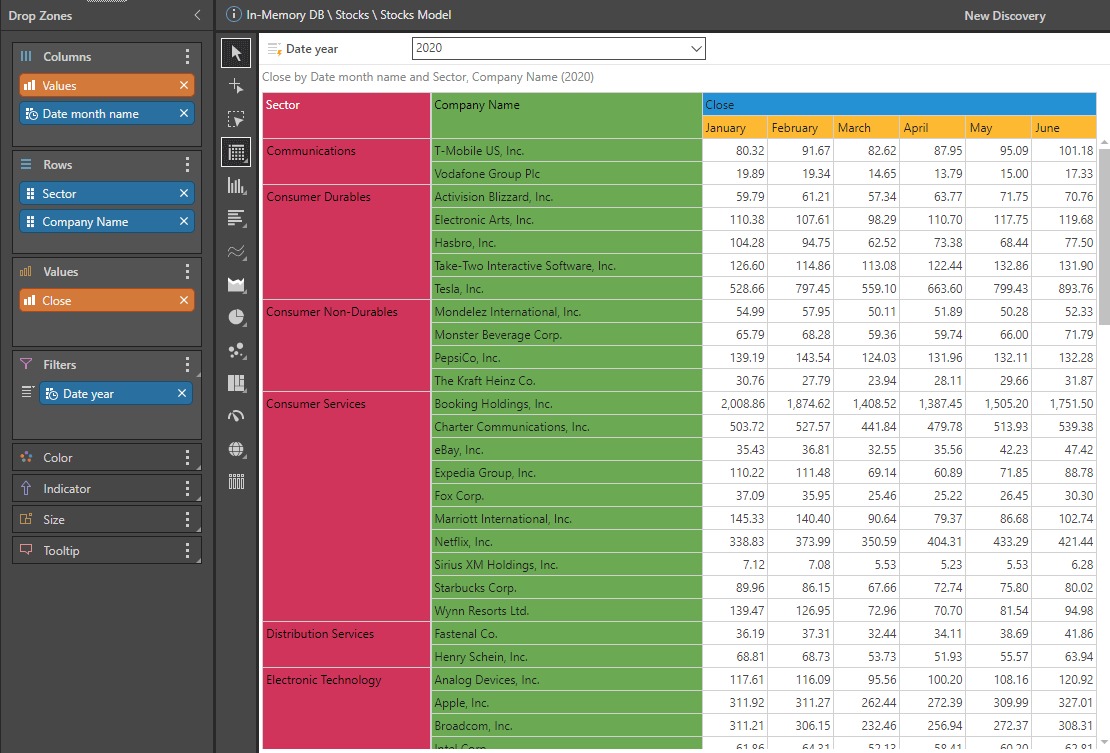
By simply dragging and dropping month, company, and close price into the drop zones—and then adding a year filter—I have an interactive report that I can further slice and dice according to all hierarchies and measures that are available.
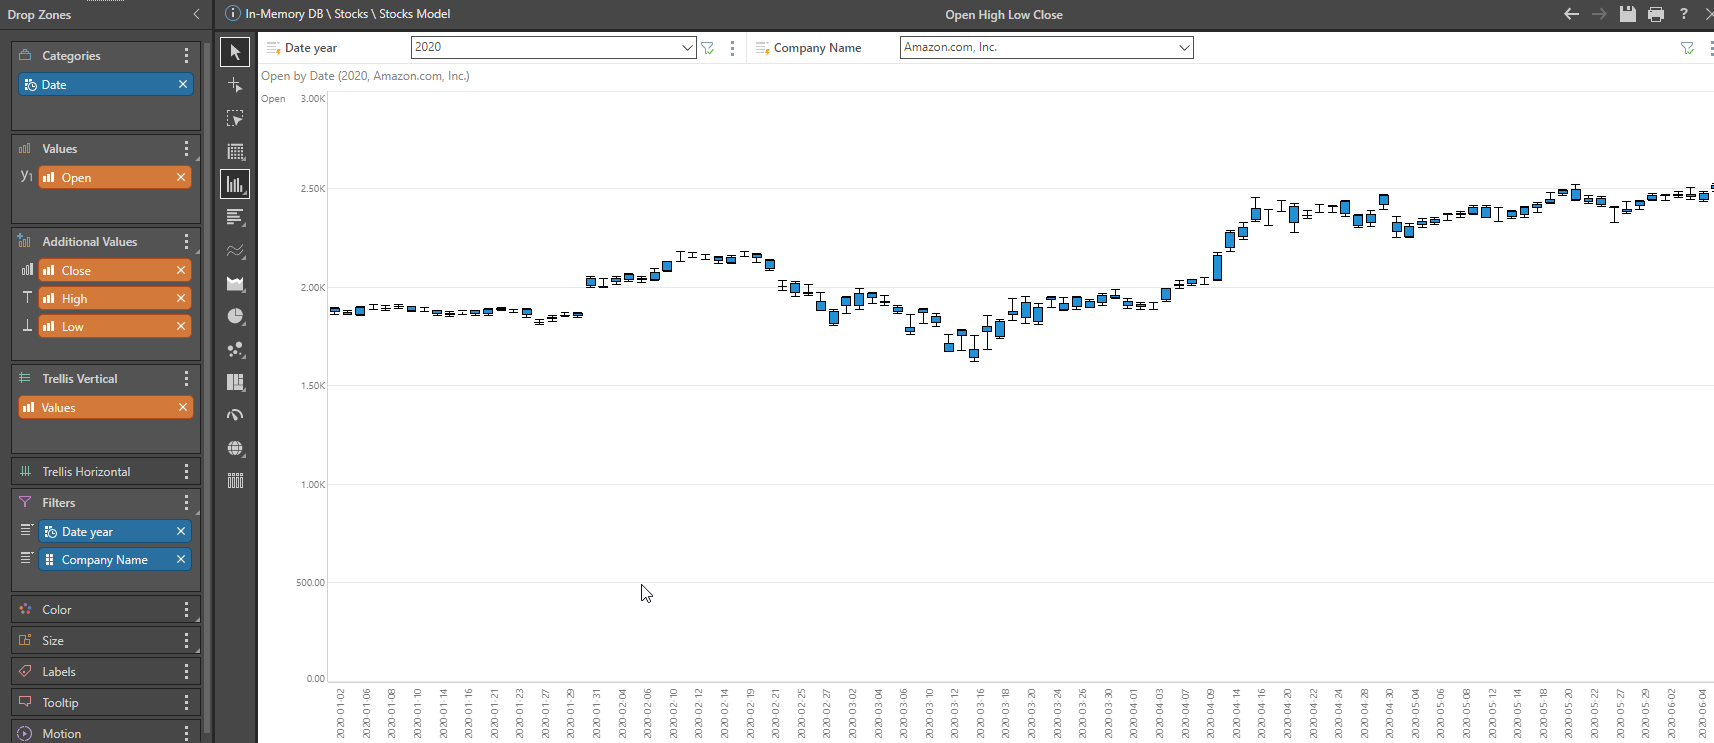
I now want to create a candlestick chart using open, close, high, and low prices, and then further analyze per company by creating an additional company filter. I simply drop the measures in the pertinent pre-defined areas for the candlestick chart, defined in “Additional Values” area in the drop zone, and I instantly have a clear picture of a selected company’s performance over time.
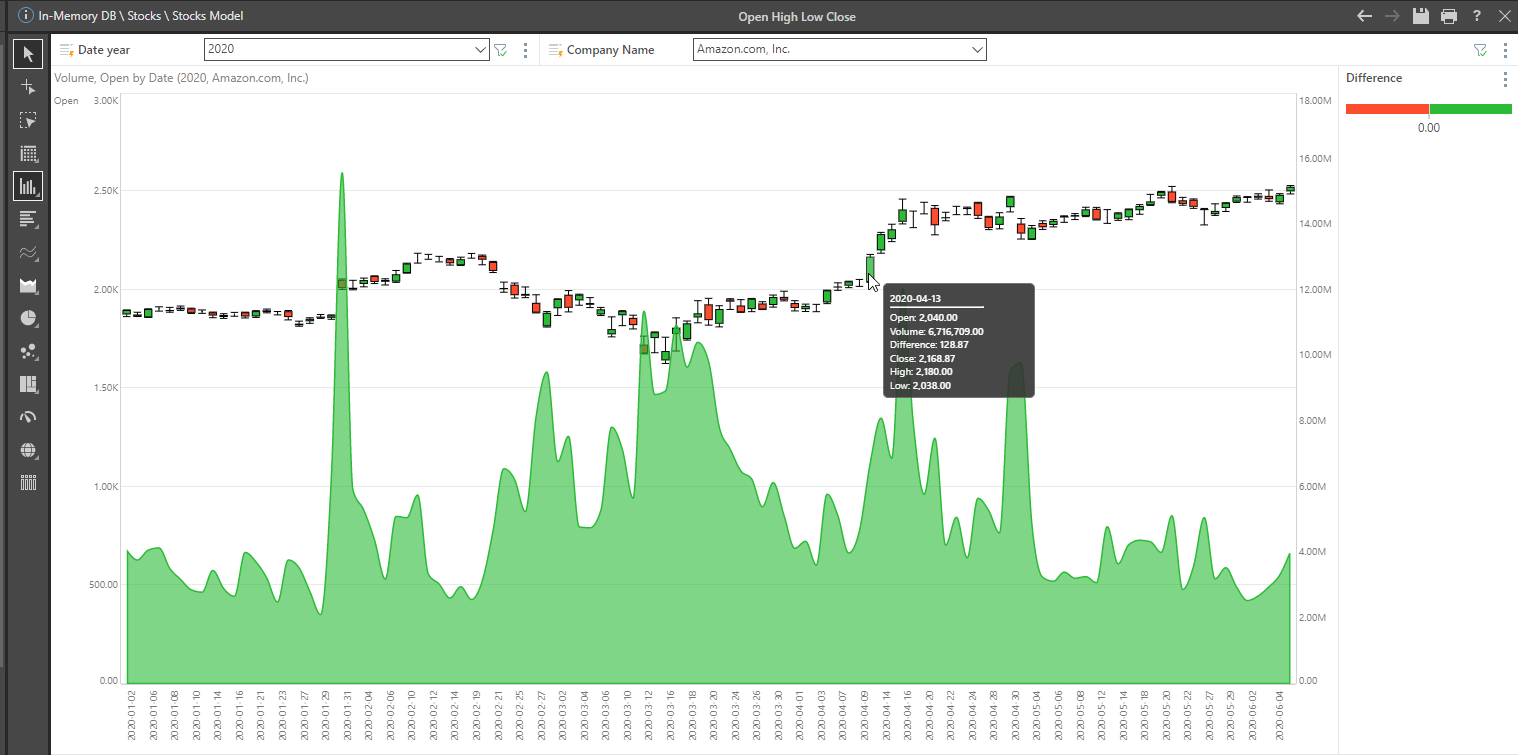
To further enhance the graphic depiction, I can display the difference in the daily open and close price with just a few points and clicks.

To do this, I use the Create Measure function (Constructed Functions, Subtraction) to then add a new “Difference” measure to the “Color” dropdown, selecting positive and negative as a method of display. Then I simply add the volume measure, selecting secondary spline area chart as the display method, and presto: I have a graphically pleasing, intuitive chart that I can further manipulate at will. Better still, I did it all without programming or “heavy lifting.”
Using the Model tool’s scheduler, I can then create a schedule (using any time interval from minutes to months) to run the entire data flow and reports in an automation.
Summary
Pyramid enables Python code to be used either as a data source or for data manipulations, allowing resultant data to be written back to a database. Python users wanting to perform analytics require a self-service BI tool to access data sources and create dashboards, presentations, and reports. The Python environment excludes non-coders from testing—and further, analyzing models using self-service BI tools. Third party vendors have serious limitations integrating Python: it is limited to small data sets, can only be performed on the aggregated values, and cannot be performed on values created using Python. Python Machine models cannot be created, saved, and shared.
In contrast, Pyramid integrates Python into its Model tool, allowing users to utilize Python code as a data source or as a data manipulation and calculation add-on to existing data sources. What’s more, machine learning scripts can be shared and re-used in other data sources and the governance of the Python scripts is maintained with managed access and content versioning.
In addition, non-technical team members can extract and prepare data using drag and drop functionality, saving huge development effort. Pyramid provides the ability to write back results from the Python code to the original data source. A marketplace with free reusable Python source code provides non-technical analysts with a large library of predefined functions. Editing, code-creation, testing, and running of Python code can all be performed from within Pyramid. Pyramid’s entire self-service BI is then available for all analysts to create dashboards, reports, publications, et cetera from the resultant data model.


