Forecasting is an indispensable requirement for any modern organization looking to gain a competitive edge. To do it well, today’s companies need the flexibility to adjust algorithms and define their own criteria to best suit their particular business needs. However, many business intelligence tools limit users’ ability to fine-tune forecasting algorithms.
Pyramid provides out-of-the-box forecasting that can be performed with a single click. More advanced manipulations of parameters can be achieved using Pyramid’s advanced forecasting dialog. And when a user has a specific forecasting requirement, he or she can deploy custom scripts to achieve this.
In a previous blog, I demonstrated how Pyramid had made Python (and R) a first-class citizen in its architecture and product strategy, using a stock market example to highlight this. In this blog, I will demonstrate how Python (and R) scripts can be used to meet customized forecasting requirements.
The problem
- Third-party BI tool vendors offer a proprietary “black box” forecasting method where users have no understanding of the algorithm being used and no ability to further tweak it to better fit their unique circumstances.
- Data scientists with deep domain knowledge often need to be able to apply their own Python and R scripts to generate a more accurate forecast.
- They may also want to introduce additional parameters or logic to expand the forecasts beyond the current algorithm.
Pyramid’s solution
- Pyramid gives users the power to deploy customized Python and R scripts to perform a forecasting function.
- A marketplace with free reusable Python source code provides non-technical analysts with a library of predefined forecasting functions.
- Existing Python scripts can be further customized to suit more specific business requirements.
- Scripts can then be shared (and optionally versioned) in the governed content management platform.
- They can also be configured to run with specific package versions using specific Python or R versions in a virtual Python environment.
Business case
Janice is a data scientist for R&G Distributors. R&G uses Oracle as a data warehouse and Pyramid for data visualization, reporting, and analytics.
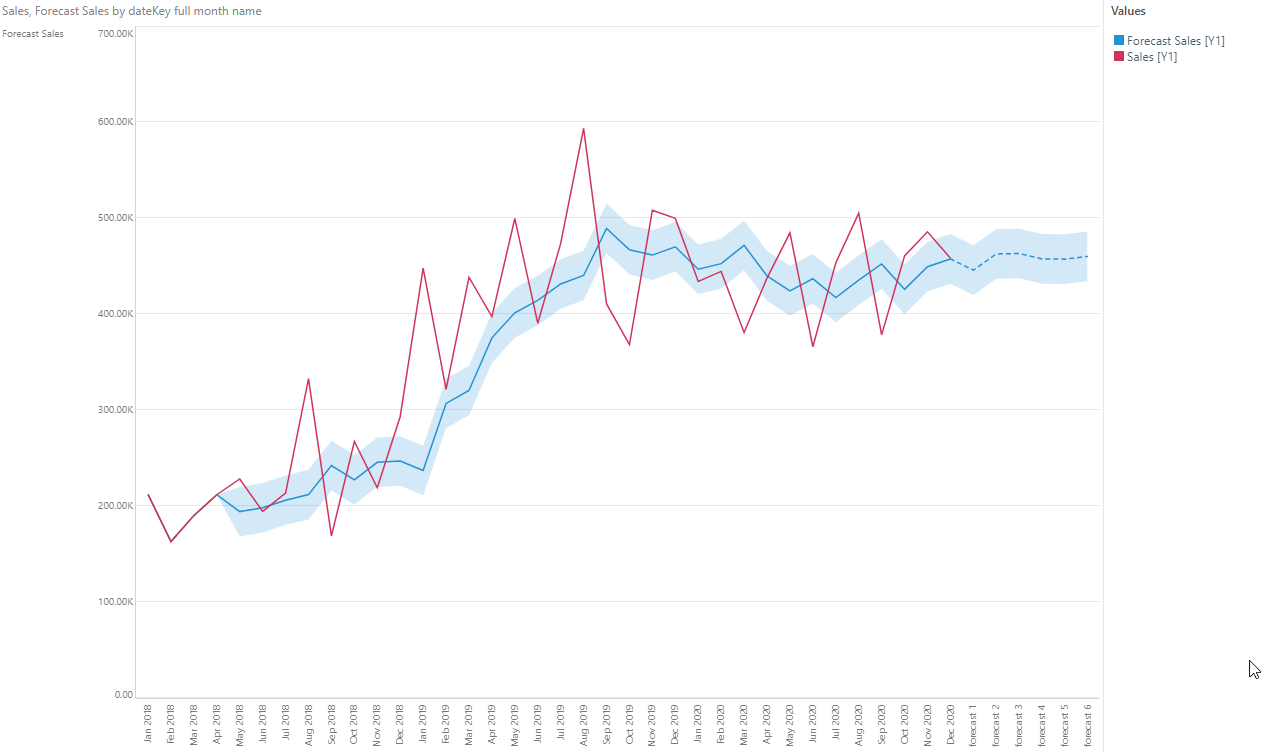
Janice wants to apply a forecasting algorithm that calculates forecasted values based on previous averages. Using Pyramid, Janice creates a graph depicting sales for the last three years.
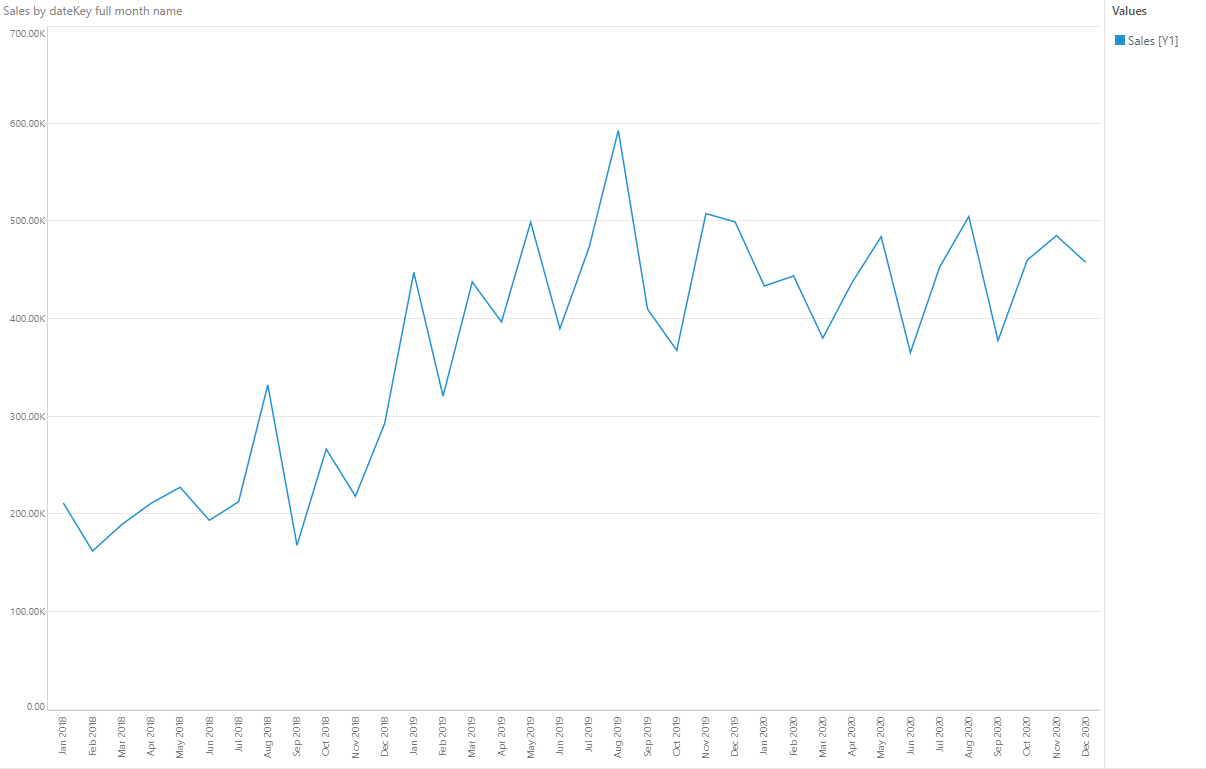
From her Discover report, Janice applies her own Python script that forecasts sales based on previous averages.
import scipy.stats as st
import pandas
def pyramid_forecast(dataLst, period, futures, shouldCalcHistory):

  if period == 0:
    period = 6

  size = len(dataLst)
  movingAvgs = []
  if size < period+1:
    return pandas.DataFrame({'forecast': []})

  if shouldCalcHistory:
    startIdx = period-1
    for i in range(startIdx, size-1):
      sum=0
      for j in range(0,period):
        sum += dataLst[i-j]
      movingAvgs.append(sum/period)

  # Future predictions. First
  for i in range(0,futures):
    sum = 0

    # take the last element of the data into the some
    elementsToTakeFromData = period-i
    for j in range(size-elementsToTakeFromData, size):
      sum += dataLst[j]

    if elementsToTakeFromData < 0:
      elementsToTakeFromData=0

    # take the rest of the elements from the moving avgs itself (includes predictions)
    elementsToTakeFromPredictions = period-elementsToTakeFromData
    for j in range(len(movingAvgs)-elementsToTakeFromPredictions, len(movingAvgs)):
      sum += movingAvgs[j]

    movingAvgs.append(sum/period)

  interval1High = []
  interval1Low = []
  interval2High = []
  interval2Low = []

  startIdx = 0
  if not shouldCalcHistory:
    startIdx = len(movingAvgs)-futures

  for i in range(startIdx, len(movingAvgs)):
    x = movingAvgs[i]
    currInterval1 = st.t.interval(0.95, len(dataLst) - 1, loc=x, scale=st.sem(dataLst))
    currInterval2 = st.t.interval(0.95, len(dataLst) - 1, loc=x, scale=st.sem(dataLst))

    interval1Low.append(currInterval1[0])
    interval1High.append(currInterval1[1])
    interval2Low.append(currInterval2[0])
    interval2High.append(currInterval2[1])

  df = pandas.DataFrame({'forecast': movingAvgs[startIdx:len(movingAvgs)],
             'interval1High': interval1High,
             'interval1Low': interval1Low,
             'interval2High': interval2High,
             'interval2Low': interval2Low})
  return df
Janice then applies the script to her report and selects historical forecasting to view the accuracy on historical data.
Janice then tweaks the algorithm by changing the previous periods from four to six, and increases the accuracy to ninety-five percent. The newly adjusted forecast is displayed automatically after she applies the changes.
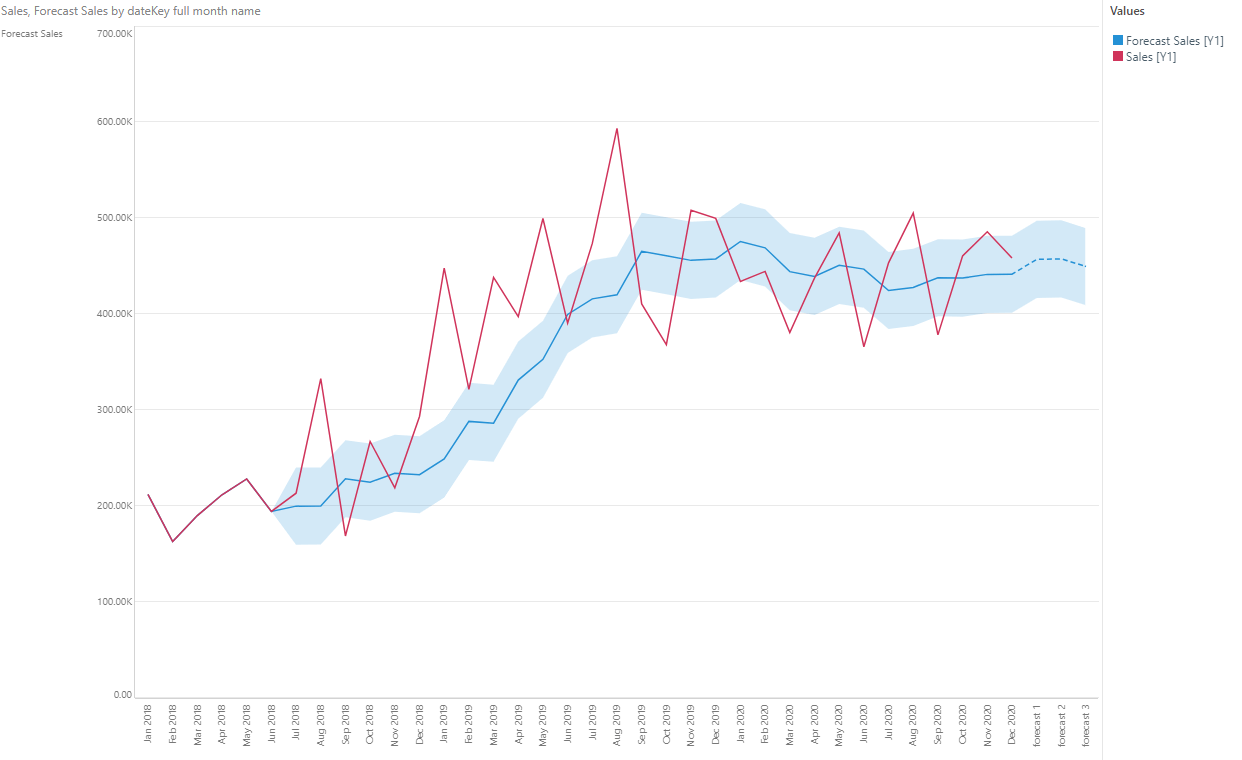
Janice can then save the adjusted script to ensure it will be available in other reports and dashboards. Janice could optionally introduce additional input factors to the Python script to further modify and enhance the script and view the desired forecast.
Summary
Pyramid provides multiple forecasting algorithms that can be executed with a single click, as well as an advanced forecasting dialog, where options can be tweaked for improved performance. Most third-party BI tool vendors only offer a standard forecasting method where users have limited ability to adjust the algorithm, with no option to write their own code.
However, data scientists need to be able to deploy customized Python and R forecasting scripts. With Pyramid, they can create and share their own scripts in a governed content management platform. Scripts can also be configured to run with specific package versions using specific Python or R versions in a virtual Python environment. Pyramid also provides a marketplace with free reusable Python source code with a library of predefined forecasting functions.


