Specialized data preparation tools have emerged as powerful toolsets designed to sit alongside our analytics and BI applications. They’re designed, in principle, to improve the quality of our data models in the face of rapidly expanding data volumes and increased data complexity.
While capable of handling many data types and sources, they’re often expensive and difficult to learn. Not all these standalone data prep platforms are end-user friendly. It’s not likely end-users would ever need all the advanced functionality they offer, and it’s even less likely they would have the time to learn how to use them.
While standalone tools let us integrate all our broad—and complex—data sources, they only add complexity to the mix. So what’s the solution? We cannot roll back time and rely exclusively on IT to prepare data for analysis and visualization tasks. Nor can we rely exclusively on the primitive data prep capabilities of desktop tools.
However, despite these constraints, it is possible to implement data preparation processes that keep pace in today’s environment. Below, we discuss three ways to reduce the time and complexity of data preparation.
Data Preparation Must Balance Ease of Use with Data Governance
While organizations have largely outgrown centralized BI implementations and associated data preparation techniques, they still need certain aspects of legacy systems such as data security and governance. Conversely, while self-service tools offer no-code agility, feature modern user interfaces, and can produce stunning visualizations, it comes at the expense of governance and security.
Today’s ETL processes must primarily suit end users since they’ll be the predominant users of analytics and BI applications today and in the future. These users expect data preparation to be intuitive and easy. After all, they’re not data experts, they’re business experts—and they prefer systems that give them data without a lot of trouble and effort. However, simplicity can be a trap; just because a solution is easy to use (e.g., Excel), it doesn’t mean it’s the right tool for the job.
A modern ETL process needs to strike the balance between power and simplicity. End users demand no-code, visual interfaces that let them connect, prepare, blend and join data from databases, cloud and on-premises sources, structured and unstructured data, and spreadsheets using standard queries, formulas, filters, and joins—all without relying on others to do it for them. However, because of the heightened fear of data breaches, it’s vital that IT continue to have visibility into how and what data is being used.
Take a look at this webinar for a deeper discussion on Governance:
Data Preparation Should be Embedded Directly in the Analytic Application
In recent years, it has become common for organizations to use standalone ETL software. However, this introduces several problems. First, it creates the need for a separate software application, which can increase the cost and administrative burden on IT departments already strapped for time—separate products require separate licenses to purchase and administer.
It also increases the learning burden on users themselves. Separate products require users to become proficient with analytic applications that have their own proprietary user interfaces and workflows. In addition, it forces users to understand the functional interrelationships between their ETL tool and their analytics and BI tool. Lastly, it reintroduces the old problem of data bottlenecks so common to legacy tools.
Modern analytic and BI applications like Pyramid Analytics include powerful ETL functionality directly in their platforms. Users can connect, prepare, blend and join data from all their sources with an intuitive, visually based user interface. Once the models are built, users can build visualizations and dashboards from the same familiar platform, without going through convoluted processes to migrate data from one tool to another—increasing speed to insight. And because Pyramid is server-based and centrally managed, all the data models created during the data preparation stage are available for others to use for their own analysis.
Data Preparation Must Practically Incorporate AI Capabilities
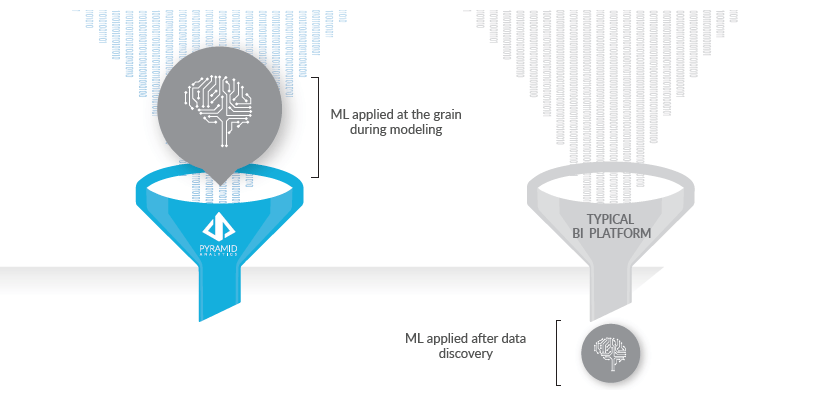
The explosive growth of data is making data preparation harder. Most organizations are aware of the need to incorporate AI and ML technologies but struggle to integrate them in a meaningful and practical way. Whilst there’s no shortage of enthusiasm to adopt AI, it’s important to focus on the aspects we can meaningfully incorporate into our day-to-day activities. Success depends on putting ML to work on data at the grain and making it easy for end users to do it.
Before we can run, we need to be able to walk. We can strive to integrate AI and machine learning into our businesses, but we must ensure that we have a technology ecosystem in place to support it. That’s why organizations should apply machine learning algorithms directly to their data during data preparation, the very first stage of the analytics process.
While it’s now common for analytics and BI applications to include ML capabilities, the functionality is often exposed to users after the data has already been prepared and aggregated. This limits the effectiveness of machine learning algorithms which work best on raw data. By incorporating machine learning to the data at the grain during the data preparation stage—and by including the data preparation capabilities within a complete analytics platform—we can quickly surface all types of data for analysis, leading to more relevant correlations and insights.
It’s also critically important that end users understand how to use the algorithms themselves. For example, Pyramid Analytics’ data preparation environment includes more than 25 machine learning algorithms (Outliers, Kmeans-Weka, Pam-R, Random Forest, Neural Net, and TensorFlow, to name a few), exposed right alongside typical blend, join, and column operations. Users can simply drag and drop these algorithms into the visual workflow on the canvas and then export the results into ready-to-analyze models. So not only can ordinary business users build models using traditional data prep tools, they can mix in machine learning algorithms using simple drag-and-drop actions—all without data science skills.
Conclusion: It’s Possible to Cut Data Preparation Time
Data preparation has become harder, not easier. The explosion of data sources has forced organizations to fundamentally change how they prepare data for analysis. Organizations can no longer rely on legacy analytic systems, nor can they rely on self-service tools that offer limited functionality. And just because standalone ETL tools offer deeper functionality for data scientists and experts, analytics are best when all analytics and BI are together on the same platform.
However, organizations can reduce the time it takes to prepare data if they adopt end-user-friendly ETL processes; they integrate ETL processes on the same platform with other data analysis, visualization, dashboard, and reporting functionality; and they expose machine learning during data preparation so business users can apply algorithms to the raw data instead of aggregated data.


