Today, more businesses are using machine learning (ML) to perform business predictions. They rely heavily on their small team of data scientists to drive these initiatives.
As organizations adopt advanced ML techniques into daily analytics, we see three key trends emerging. First, Python is now the predominant language being used by data scientists for all things ML and beyond—outpacing R and replacing SAS. Second, there is a groundswell of demand for access to these capabilities by “citizen data scientists” and classic data consumers. This feeds a third trend: a heavy push to merge data, analytics, and data science pipelines into a singular, interconnected technology arc.
Sidebar: Learning, evaluating, and predicting The process of learning, evaluating, and predicting using ML is classically performed in three distinct stages. In the initial stage, the ML code is run on a sufficiently large sample of data to learn and create an algorithm that will be used as a model to predict the required result. Following this, the model is evaluated and adapted, if necessary, to achieve the required accuracy. Finally, the model is classically used on a powerful server against a massive set of production data to predict results.
The challenges
Python has become the language of choice for ML projects because of its accessible language structure and a large collection of rich package libraries. However, 80 percent of data scientists’ time can be spent finding, cleansing, and organizing data—which is far less about ML and more about “ETL.” Furthermore, the language is still not for everyone and can exclude most non-code-savvy data users from testing, developing, and deploying machine learning models to produce useful outcomes.
Finally, as I have written previously about Pyramid’s Python integration, most BI tools—like Power BI and Tableau—do not offer a real-world “application pipeline” for integrating Python and R-based ML projects with classic data visualization, analysis, and reporting.
Instead of allowing users to learn, evaluate and predict, then build content in distinct phases, they expect users to insert and execute Python code and build reports and dashboards, all in one step. This is often performed on a desktop against a subset of data, severely decreasing the likelihood of accurate results. There is no framework for crunching millions of rows of data to build ML models (“learn”), and there is no venue to reapply models for predictions. In many respects, most BI tools treat Python (and R) as a side-show gimmick without providing a serious framework to produce accurate, scalable ML-driven analyses.
Pyramid’s solution
Pyramid features deep integration of both Python and R, tracking the key trends above. It acknowledges Python’s and R’s widespread use among data scientists while simultaneously giving citizen data scientists the ability to perform basic ML functions—and it enables all of this in an integrated environment that lets all users perform analytics across the full pipeline.
Aspect 1: Deep Python and R integration
Pyramid has made Python (and R) a first-class citizen in its architecture and product strategy. Pyramid integrates Python into its data modeling tools, allowing users to utilize Python code as a data source or as a data manipulation and calculation element. Python ML models can, in distinct phases, be trained, tested, and then deployed to run predictions on millions—or billions—of records and can be shared and re-used in other data sources.
Governance of the Python scripts is also maintained with managed access and content versioning. The ability to write back results from the Python code to the original data source adds further value. Pyramid provides a marketplace of free, reusable Python source code for non-technical analysts, with a large library of predefined functions. Further editing, authoring, testing, and running of Python code can all be performed from within Pyramid. This approach is central to delivering a proper “learn and predict” framework for real data sets.
Aspect 2: Empowering citizen data scientists with real ML tools
Pyramid enables both data scientists and non-coding citizen data scientists to perform testing and development of ML models while using Pyramid’s powerful model tool to perform basic ETL tasks—freeing data scientists to focus solely on data science and ML coding. The process of data extraction and preparation for a learning script normally performed by a Python developer can be performed by individuals without deep Python skills using drag-and-drop actions, saving huge development effort. This approach democratizes access to serious ML-based data operations.
Aspect 3: Bringing the whole ML workflow into a single environment
Pyramid’s entire platform drives a self-service paradigm where all users (data scientists, analysts, and non-technical end users) can use one application to run an ML project from “soup to nuts.” They can prepare data, build and process ML models, generate predictions, visualize results, create and launch dashboards, and consume insights to drive better business decisions—all from one spot.
Business case
Lynette is a data scientist for M&P Furniture Finance. They use SAP HANA for their data warehouse and Pyramid for their BI development and analytics. Lynette wants to apply a Python script to predict possible customer defaults on future payments.
She will use her script to learn from a sample of their large dataset, save the model, and then reuse the same model to perform predictions. The script (which is freely available in Pyramid’s marketplace) uses random forest, a slight variation of a decision tree, to predict customer payment defaults. The random forest builds multiple decision trees and averages the results to provide the best prediction.
Lynette initially selects several customer profile columns (income, number of children, number of cars) as inputs to predict the possibility of a customer defaulting on their monthly payment. Right off the bat, Pyramid’s data preparation capabilities come into play. An Income_Period column indicates if the income is annual or monthly. Lynette uses Pyramid’s data cleaning functions in the Model tool to convert all income to an annual amount.

She then includes her Python script to run the random forest algorithm on the data.
import pandas
from sklearn.ensemble import RandomForestClassifier

def pyramid_learn(df):
target_feature_idx = df.columns.size-1;

X = df.iloc[:,0:target_feature_idx]
y= df.iloc[:,target_feature_idx]
clf = RandomForestClassifier(max_depth=5, n_estimators=10, max_features=1)
clf.fit(X, y)
return clf

def pyramid_eval(model, df):
target_feature_idx = df.columns.size-1;

X = df.iloc[:,0:target_feature_idx]
y = df.iloc[:,target_feature_idx]
output = model.predict(X)
correctCount=0
for idx,item in enumerate(output):
if item == y.iloc[idx]:
correctCount+=1
return str(correctCount / len(y))

def pyramid_predict(model, df):
output = model.predict(df)
return pandas.DataFrame({'prediction':output})
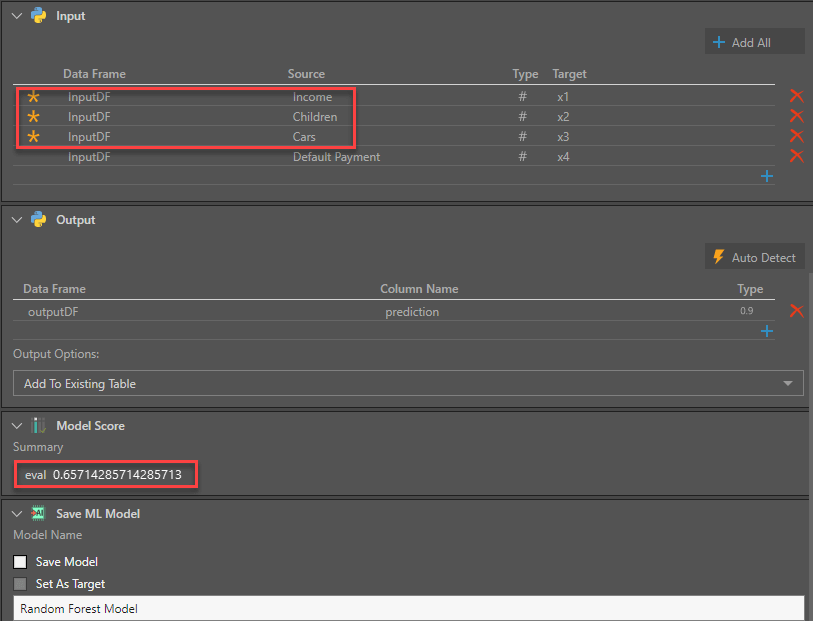
This model uses family income, number of children, and number of cars as input columns and produces a Model Score accuracy of 65.7% when run on a dataset of 200,000 rows of data.
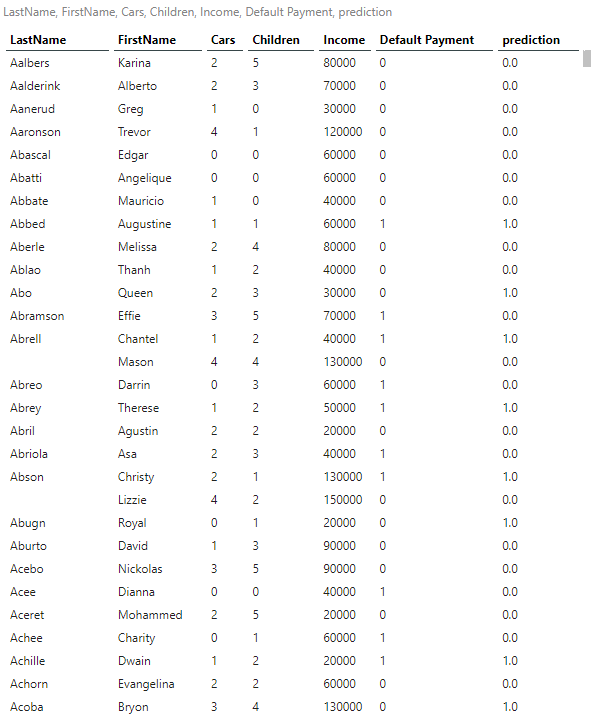
The report displays the number of cars, number of children, income, default payment (0 = No, 1 = Yes), and prediction of default payment (0 = No, 1 = Yes). We see the prediction to be in line with the accuracy predicted by the model.
After experimenting with various input columns, Lynette uses Pyramid’s data model tool to combine family income and number of family members to produce a new column—Income Per Member. In addition, she changes the number of cars column to a Boolean column—Cars YN, as the number of cars does not prove to be a significant factor, whereas the absence of ownership of a car is a significant factor. With these changes, Lynette’s Model Score accuracy improves to 82.7%.
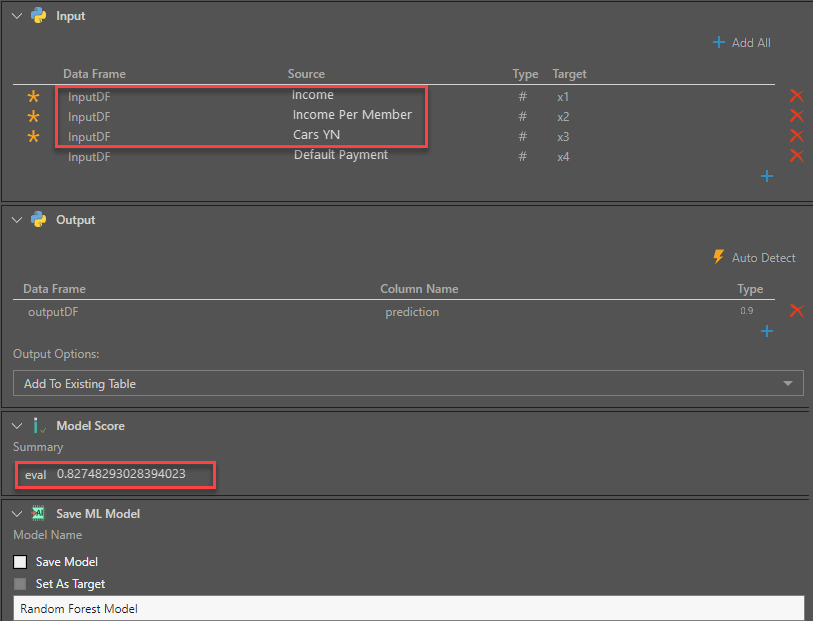
Lynette now applies the Python script with the adjusted input columns and saves the model so it can be reapplied to her massive dataset of 50 million rows to predict payment defaults for each credit customer. In addition, this same model can be applied daily to new customers as a scheduled job.
But there’s more to the story.
John is a BI Analyst who is also interested in predicting payment defaults for his dataset of prospective clients used by the call center. His dataset is separate from Lynette’s. He has not yet run any ML predictions on it. While John has limited experience with Python scripts, he can use Lynette’s for his own dataset. He just needs to apply the saved model to his. Then he can immediately identify customers likely to default on the payment. Thus, John can immediately harness Lynette’s efforts, saving the organization time, money, and resources.
Summary
Python has become an increasingly popular language for organizations running ML predictions to help them with key strategic and operational decisions. However, creating meaningful ML applications requires data to be trained on a model in a batch process using powerful servers. Further, the algorithms used to perform the predictions need to be evaluated and fine-tuned to increase their accuracy. Then the predictive algorithms need to be applied to data sets that sometimes contain billions of rows.
These advanced functions cannot be performed on a desktop BI solution with insufficient hardware, on a small subset of data within a report, where the model cannot be saved and the results cannot be stored, as is done by most third-party BI tools.
In contrast, Pyramid provides a robust, scalable Python integration that allows distinct learning, evaluation, and prediction processes in a server-based batch processing environment, where the resultant model can be saved, shared, and reused to perform additional prediction tasks. The prediction can also be saved and reused in all related analyses.
What’s more, normally complex data extraction and preparation tasks can be easily accomplished using Pyramid’s drag-and-drop modeling tool, saving huge development time and effort. This accessible tool also makes it infinitely easier for citizen data scientists who may not have the same level of expertise with Python. Lastly, Pyramid’s entire self-service BI platform provides a one-stop-shopping experience for the entire arc, from the very start to the very end.


