In this part 1 of my blog series on contextual calculations, I explore running totals in Pyramid. Running or cumulative totals allow business users to see how different metrics add up from the first item in a report to the last item.
The problem
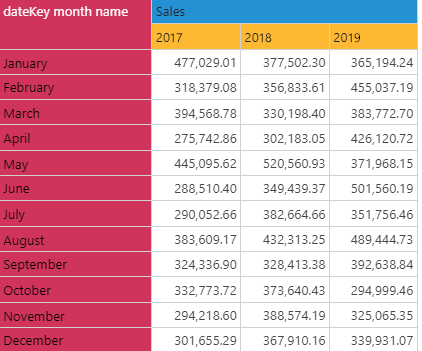
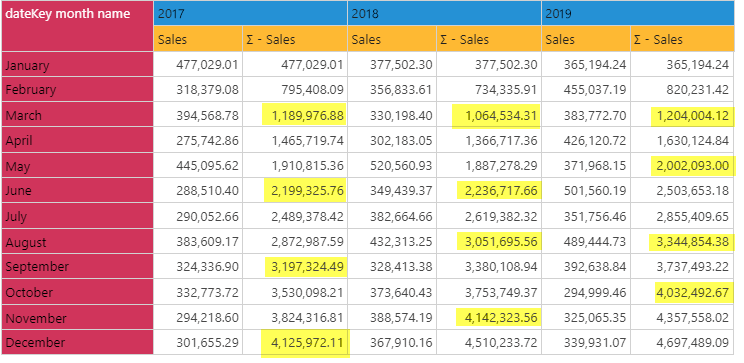
Consider the following business problem. A business user sees monthly amounts of sales and would like to track when important milestones have been reached. In order to achieve this, he would like to see running totals of sales so he can track when a $1m milestone was achieved. Due to the ad-hoc discovery nature of his investigation, he might also want to track this on different levels of granularity, such as by quarter, by month, or by week.
In the image below, the user is not able to see when the $1m, $2m and $3m milestones were achieved.

Creating running totals is often part of an ad-hoc reporting exercise that requires finicky coding with a dependence on developers and the associated software development lifecycle. In Pyramid, however, you can create running totals in a simple one-click step—no coding required.

The headaches found in most BI tools
For each calculation the user will need to write code specific to the combination of dimensions and measures he wants to view in his visual or report. This is normally beyond the capabilities of most consumers, and even some proficient end-users will require assistance from an experienced developer. This introduces the common time-to-result lag of specifications, documentations, development, testing etc. In our example, the developer will need to create three different variables for company, salesman and branch, each with three different time options for quarter, month and week, resulting in nine separate variables, each requiring their own code. YIKES!
Here’s a sample of DAX code for a running total (this would have to be copied and adjusted nine times):

At this point, business users will either spend a large amount of time creating all the variables and code required for this solution, or decide that it is not worth the effort and instead use off-line tools like Excel that destroy the centrality of analysis and reporting.
Running totals in a single click
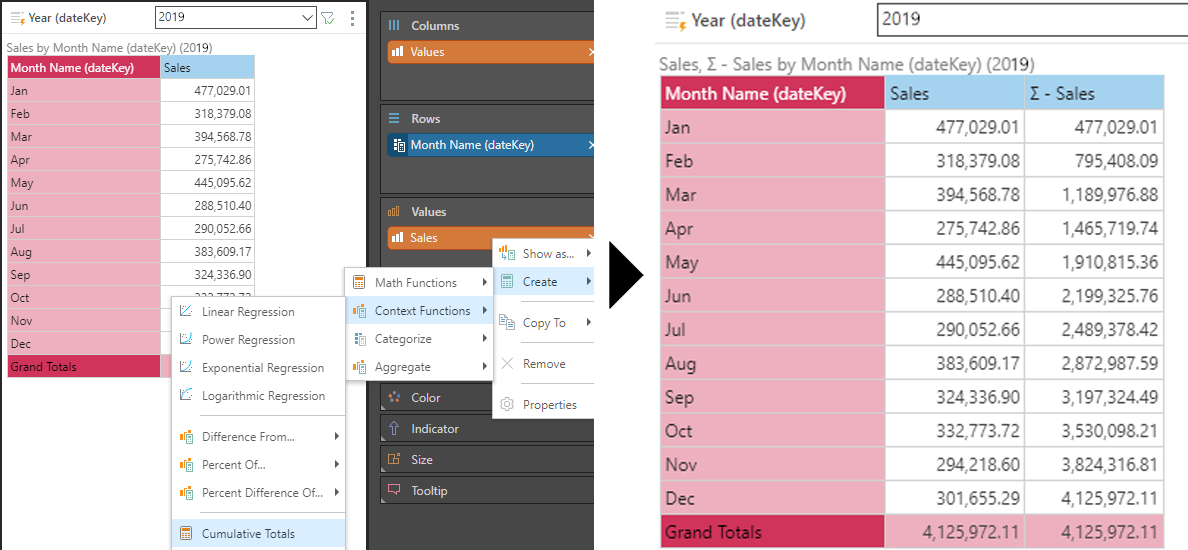
With a single right click on sales metrics in Pyramid’s Discover tools, the user can add a dynamic “Cumulative Total.”

And when you swap out months or any other hierarchy or add additional hierarchies, the running total is automatically recalculated, no further coding required.
Conclusion
With Pyramid the user can create a running total that:
- Does not need any developer input
- Only requires a few clicks
- Can instantly re-use the same function, even after changing other selections in the report


