Pyramid provides users flexibility over how to apply subtotals in a multi-dimensional matrix grid—using a simple point and click interface.
Adding subtotals to a table or grid enables users to quickly grasp values per dimension or hierarchy. Subtotal functions are often toggle switches that provide subtotaling for either all dimensions or none. This can result in displaying unnecessary subtotal details, confusing and frustrating users.
Pyramid allows users to customize which hierarchies will have subtotals (or not). These can be set for both columns and rows in a classic matrix grid visualization. Additional total functionality allows positioning of totals before or after details. This also includes being able to specify the totaling functions including sum, count, average, min, max, median, and standard deviation.
Example
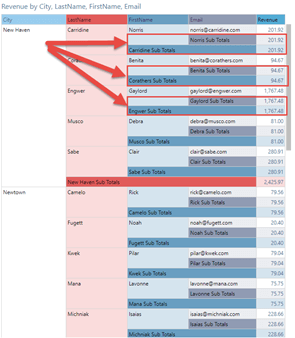
This Revenue report includes standard subtotaling, but as last name, first name, and email are displayed, the subtotaling is added to all items. This results in unnecessary totaling detail for first name and last name, creating a somewhat unusable report.

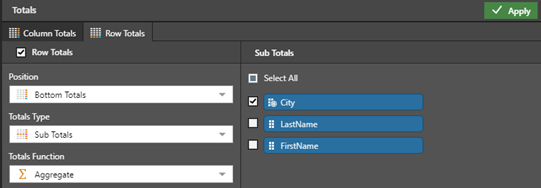
Using Pyramid’s Total Dialog allows users to easily select position, type of totals, and the type of aggregating function to apply to both rows and columns. Importantly, the user can deselect the LastName and FirstName hierarchies, ensuring subtotaling is only applied to the City level, making the result clear, concise, and more useful.


Summary
Pyramid users have complete control over totaling in grid visualizations including the level at which subtotals are calculated and displayed—for both rows and columns. This means the subtotaling of unnecessary hierarchies can be avoided, resulting in more intuitive, uncluttered visualizations. Together with Pyramid’s additional flexible positioning and total aggregation functions, users can design reports to perfectly match their requirements.


