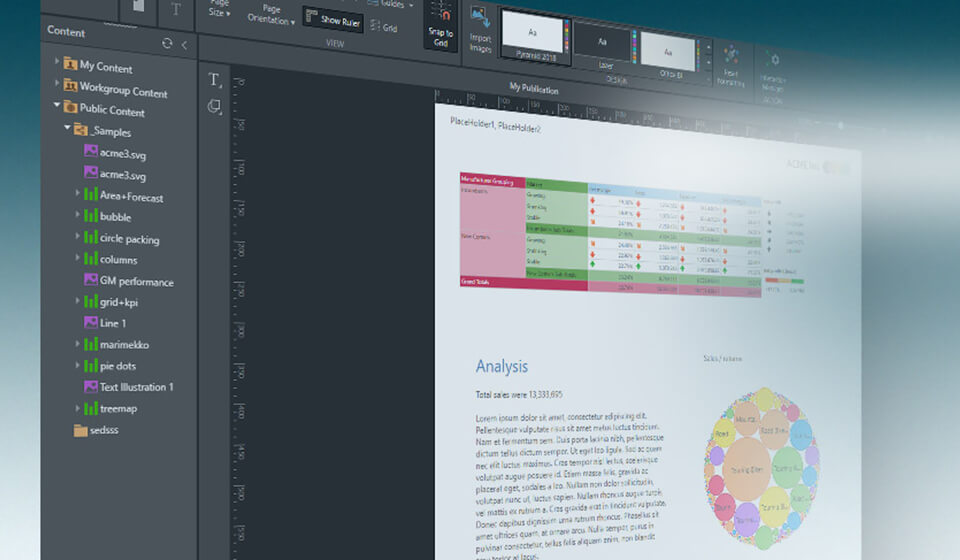
Pyramid’s Analytics OS comes with an integrated Publish module for designing analytic publications and enterprise reporting directly within our analytics platform. It contains a set of completely self-service tools for generating multi-page, multi-query, highly curated analytic narratives that leverage existing content created in the platform.
Why did we include enterprise reporting in our application, while other solutions limit or exclude this functionality altogether? Because reporting matters—in every department, in any organization. And because end users shouldn’t have to wait for others to prepare reports for them. Despite premature proclamations of its demise, reporting remains a vital component of business communication.
Where other BI solutions fall short
Many BI solutions on the market today do not provide suitable reporting toolsets required for truly self-service enterprise reporting. They make it difficult to publish analysis in reports, provide only rudimentary reporting capabilities, or leave the functionality out altogether.
Traditional BI tools may permit users to publish advanced reports that contain KPIs and data visualizations, but they often require power user skillsets or assistance from IT. This slows the reporting cycle and delays decisions. Far worse, they force end users to extract data into Excel to build charts, and then paste that content into Word and PowerPoint. Not only is this process manual, repetitive, and time-consuming, it’s vulnerable to human error.
Some self-service BI solutions are designed to be easy for end users, but they prioritize data visualizations in interactive dashboard-style applications at the expense of more traditional rendered, published reports. The resulting dashboards lack true analytic depth and don’t contextualize the analysis with descriptive text. Crucially, they don’t fill the need for published reports still demanded by today’s executives and board members.
Complete enterprise reporting functionality
We integrated reporting functionality directly in our product because we know that the goal of analytics is to clarify complicated data so decision-makers can understand data and make better decisions. What better way to present that data than in highly contextualized, visually stunning narrative reports? Better yet, make it self-service so any user has the power to build reports without assistance.
Pyramid’s Publish module allows users to create pixel-perfect reports in multiple formats (PDF, PowerPoint, Word, Excel, HTML, JSON, and XML) that include data visualizations, static text, query-driven text and infographics. See a sample report here.
Users can take advantage of an intuitive browser-based tool to drag and drop existing content created in the Discover and Illustrate modules into a canvas-style layout. They can then use comprehensive capabilities to format content, create master pages, and craft templates to comply with corporate branding requirements.
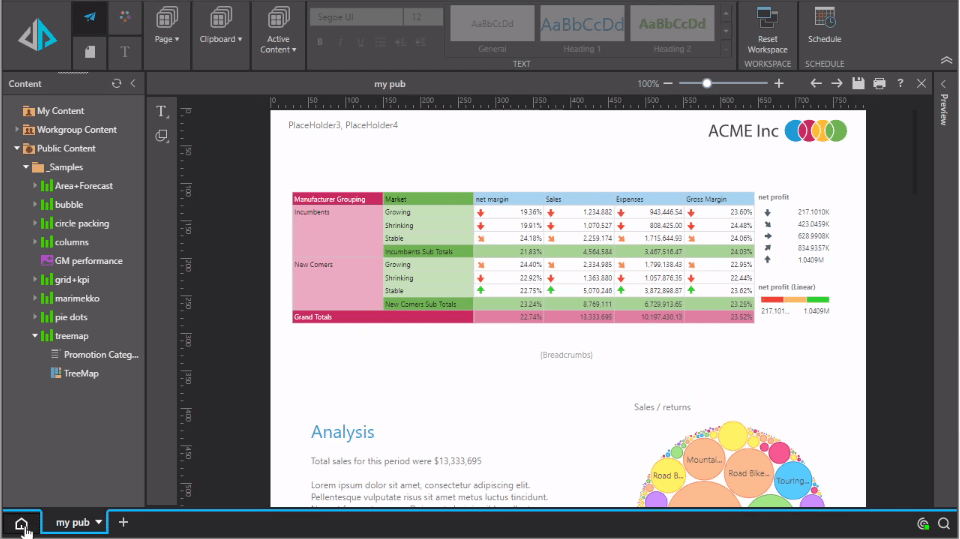
Once reports have been created, users can wire up dynamic content and inject data-driven text and infographics to filter publications. Slicers give users runtime choices to change the values of the report dynamically.
Lastly, users can automate scheduling and distribution of these reports in professional formats so that the right audiences receive timely reports that are wholly customized to their needs.
Yes, reporting still matters
It is possible to create reports that can help drive business value. The key is to use an analytics solution like Pyramid that includes self-service enterprise reporting as a core part of the analytic platform. While others treat reporting as an afterthought, Pyramid treats it as the culmination of your analytic exploration.


